- Available
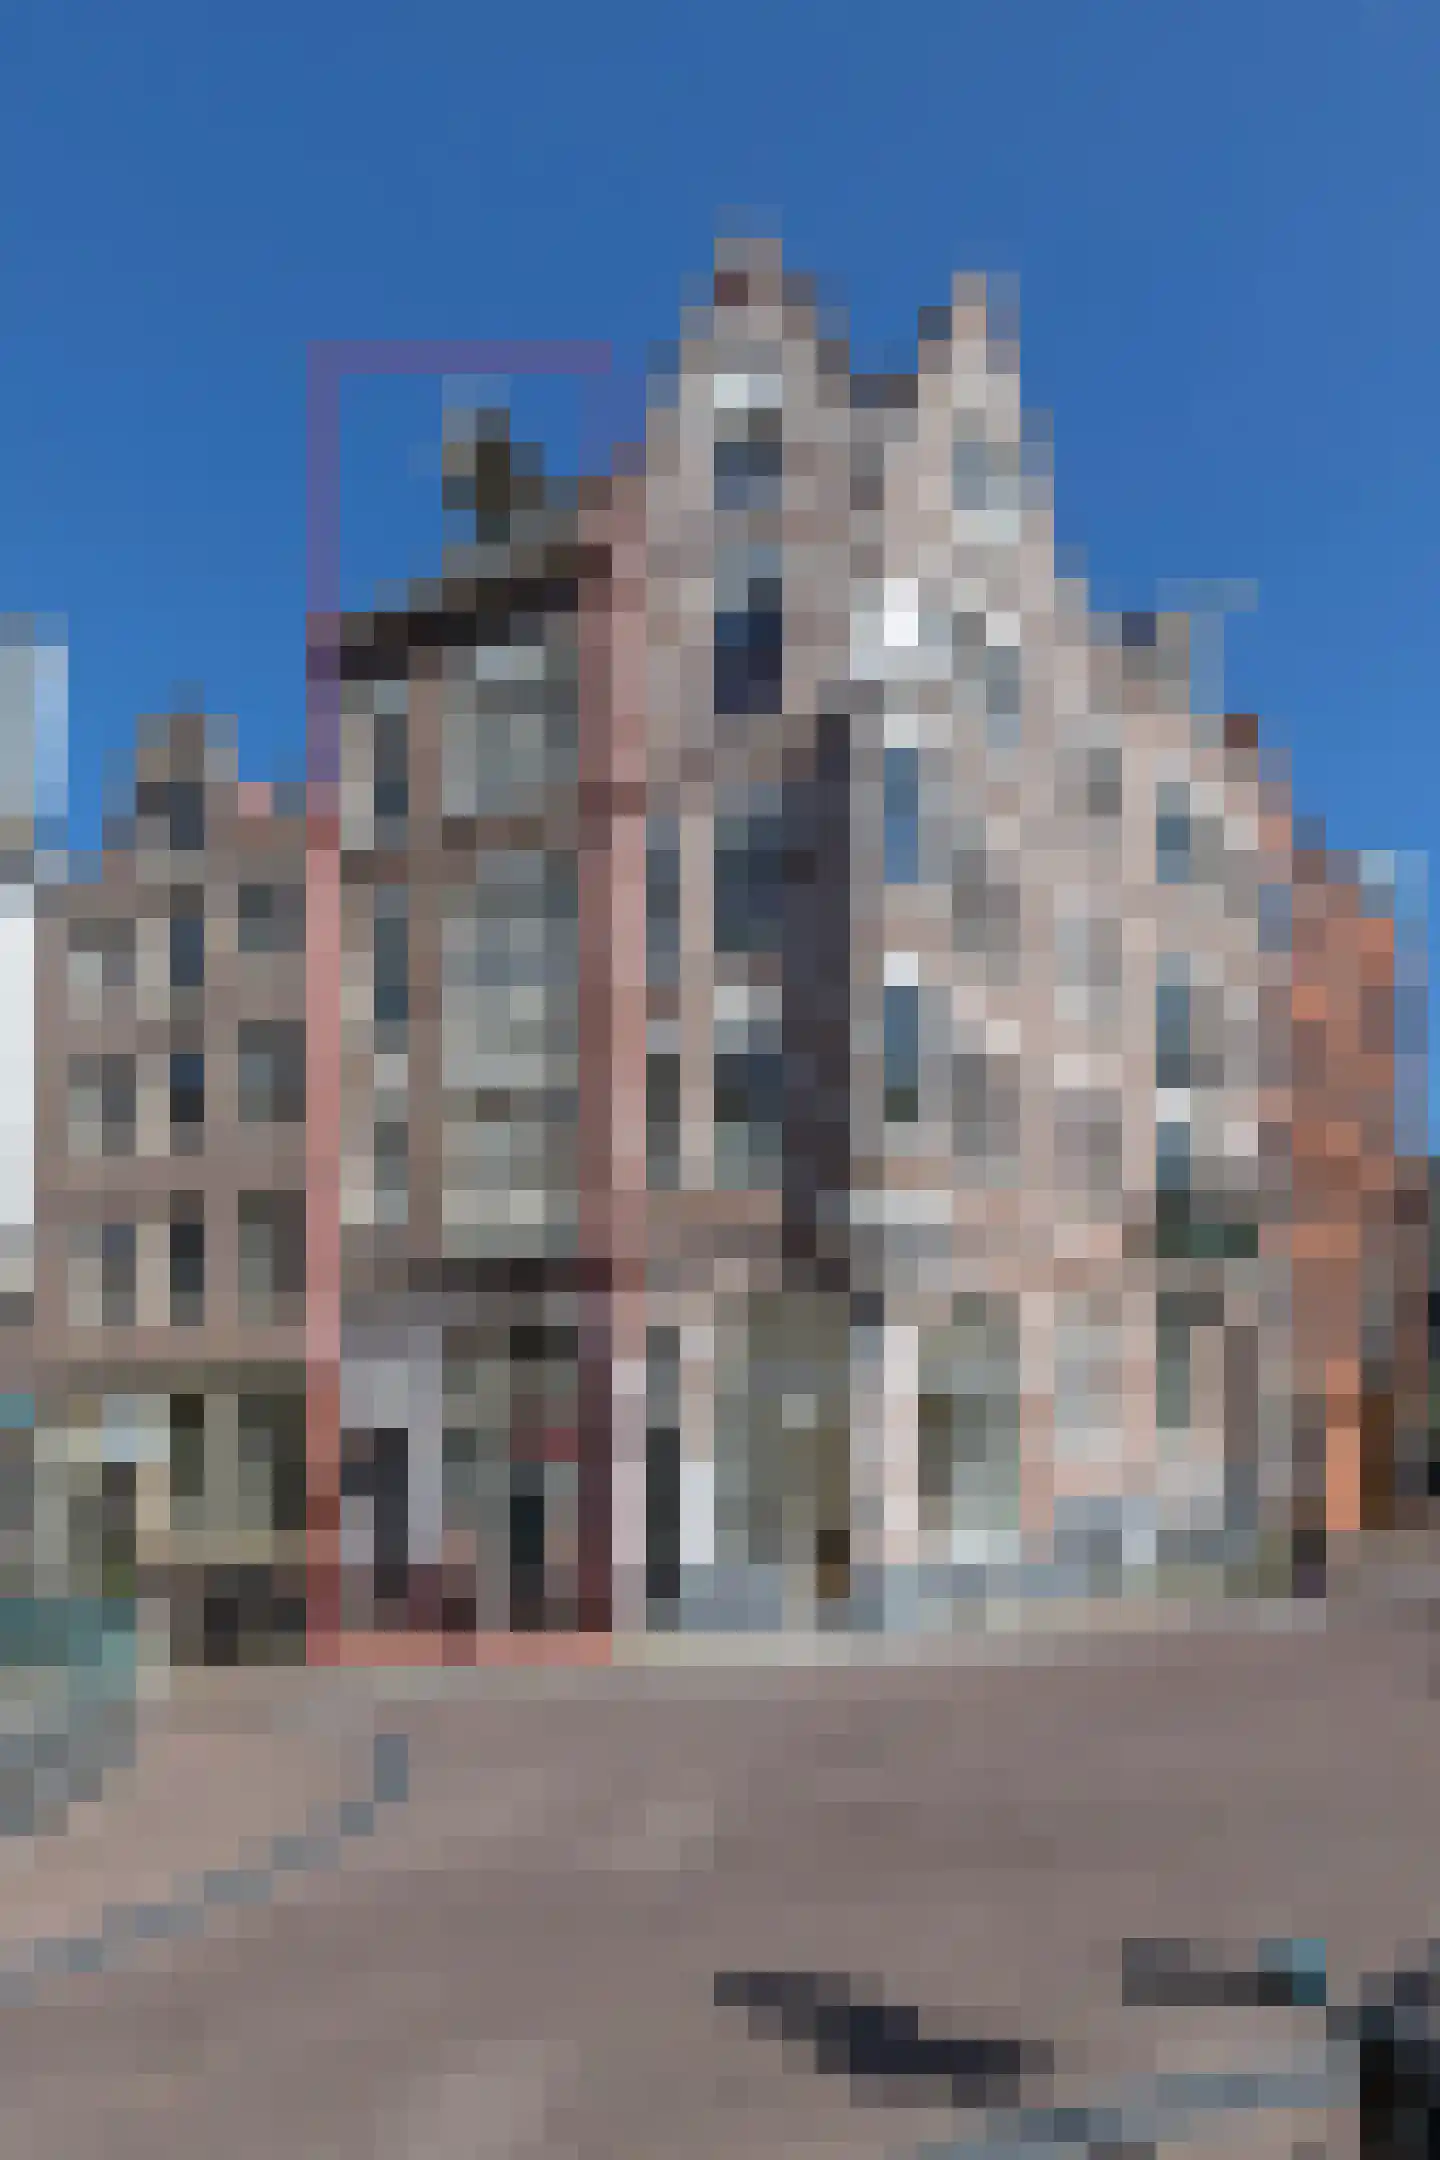
Kinderdijkstraat 48 3
1079GL Amsterdam
€ 625.000 k.k.
€ 8.333/m²
E
Save as favorite
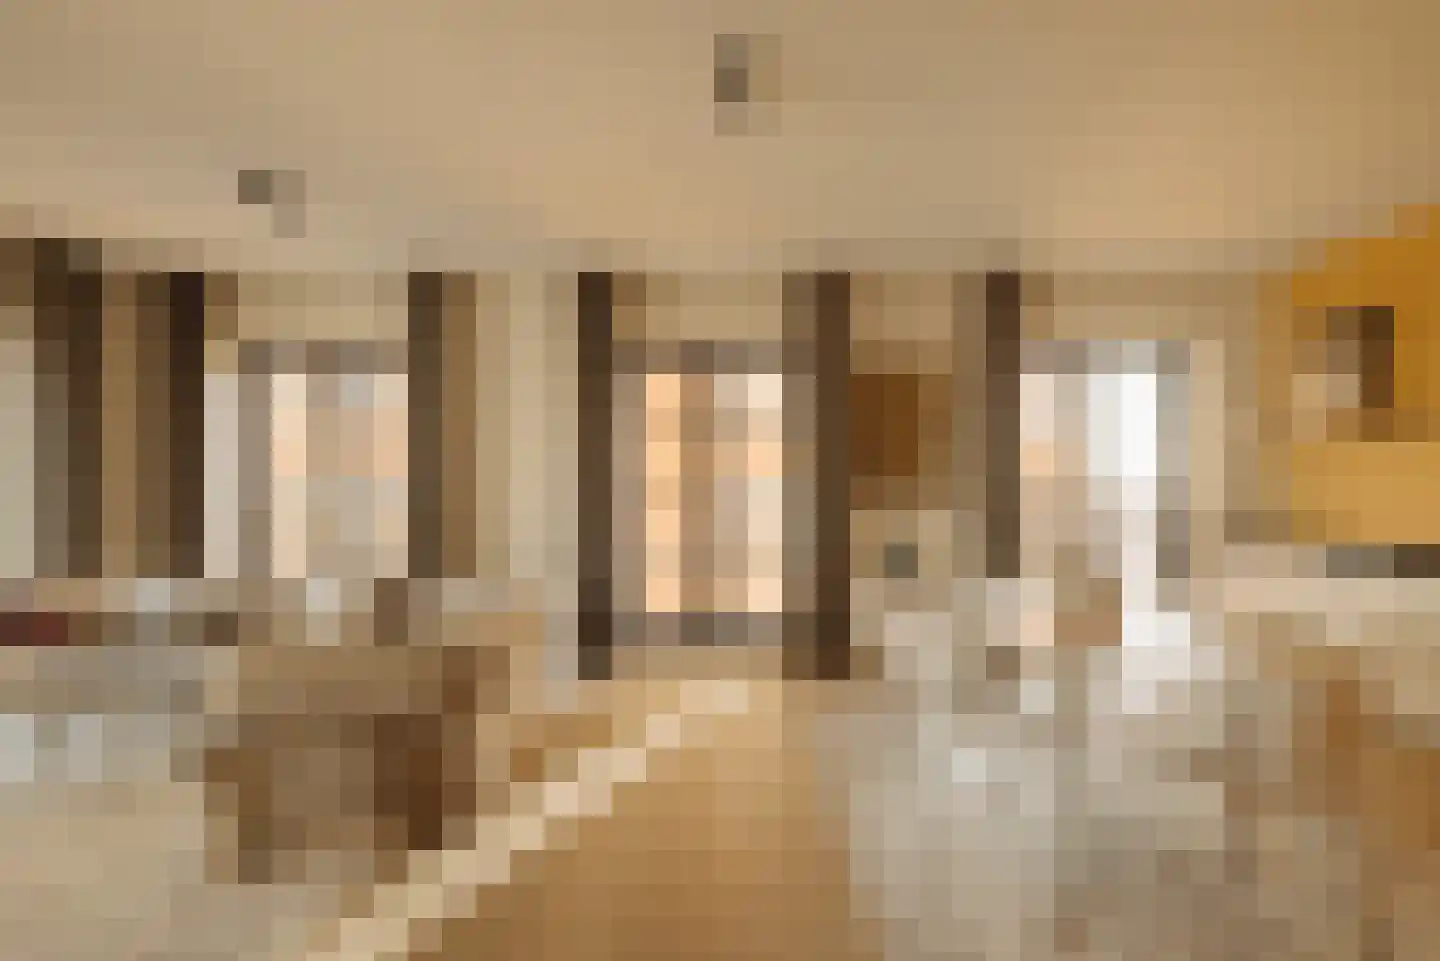
- Living area
- 75 m²
- Land area
- —
- Bedrooms
- 2