- Sold
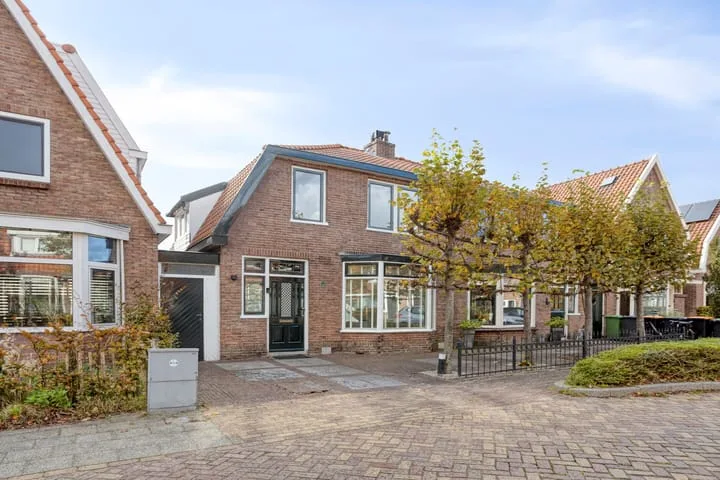
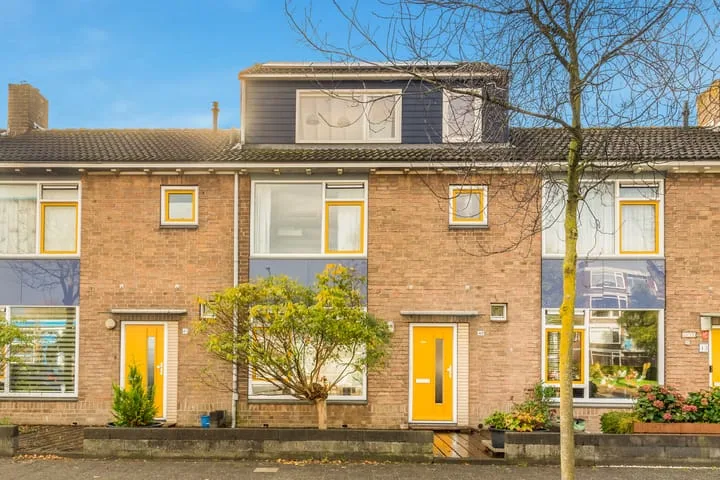
Oostertuinen 87
1944SC Beverwijk
€ 445.000 k.k.
€ 3.677/m²
C
Save as favorite
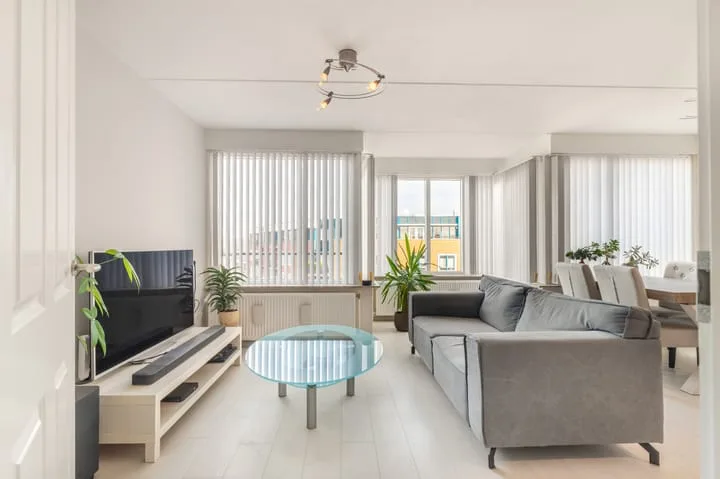
- Living area
- 121 m²
- Land area
- 284 m²
- Bedrooms
- 4