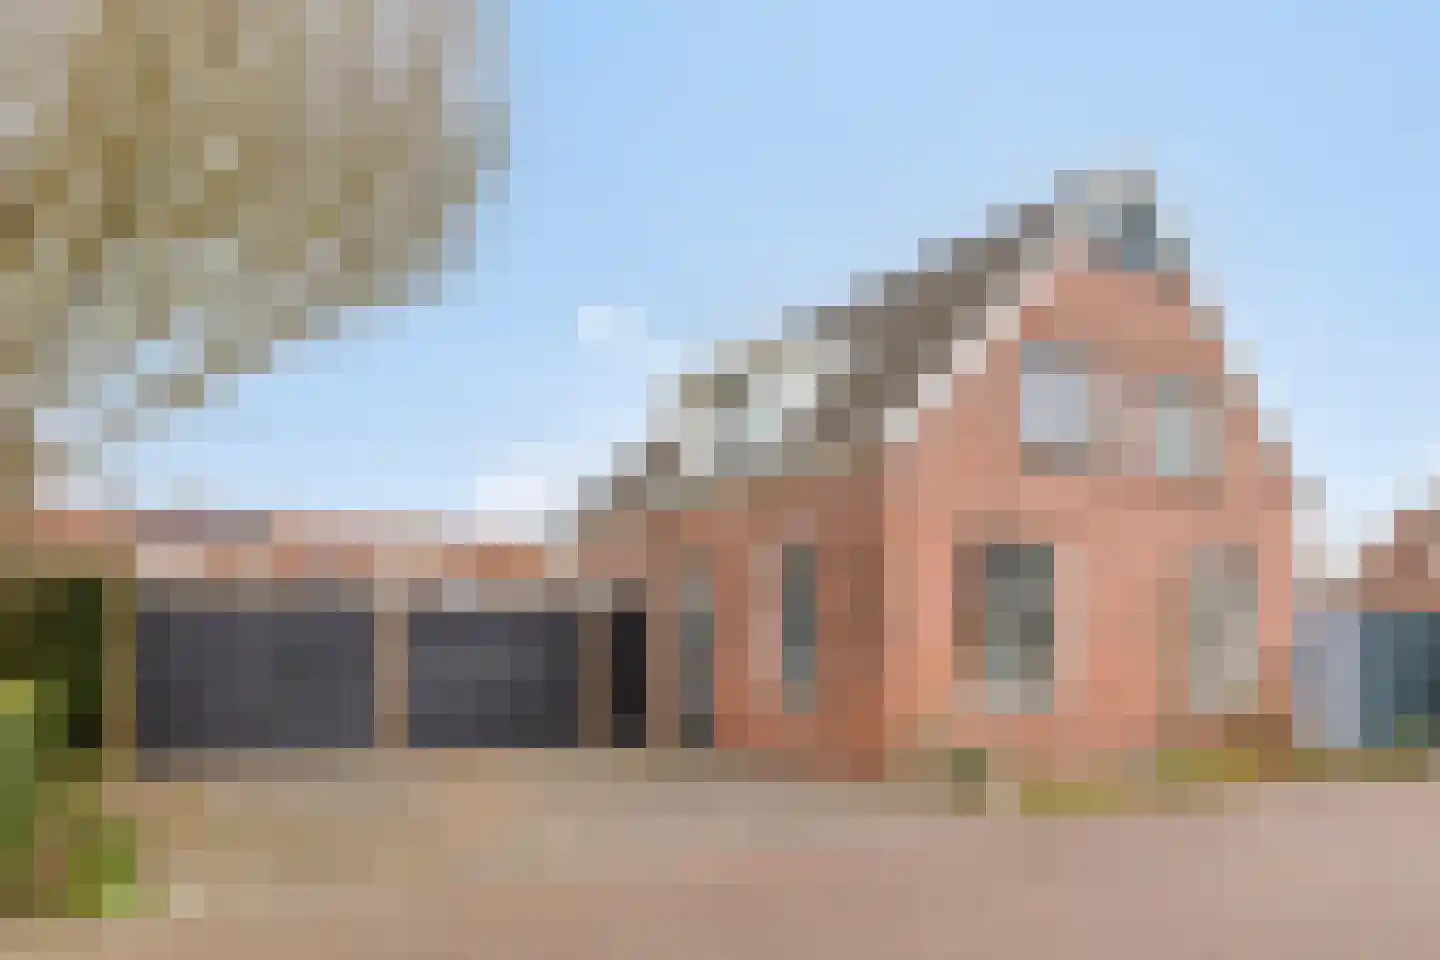
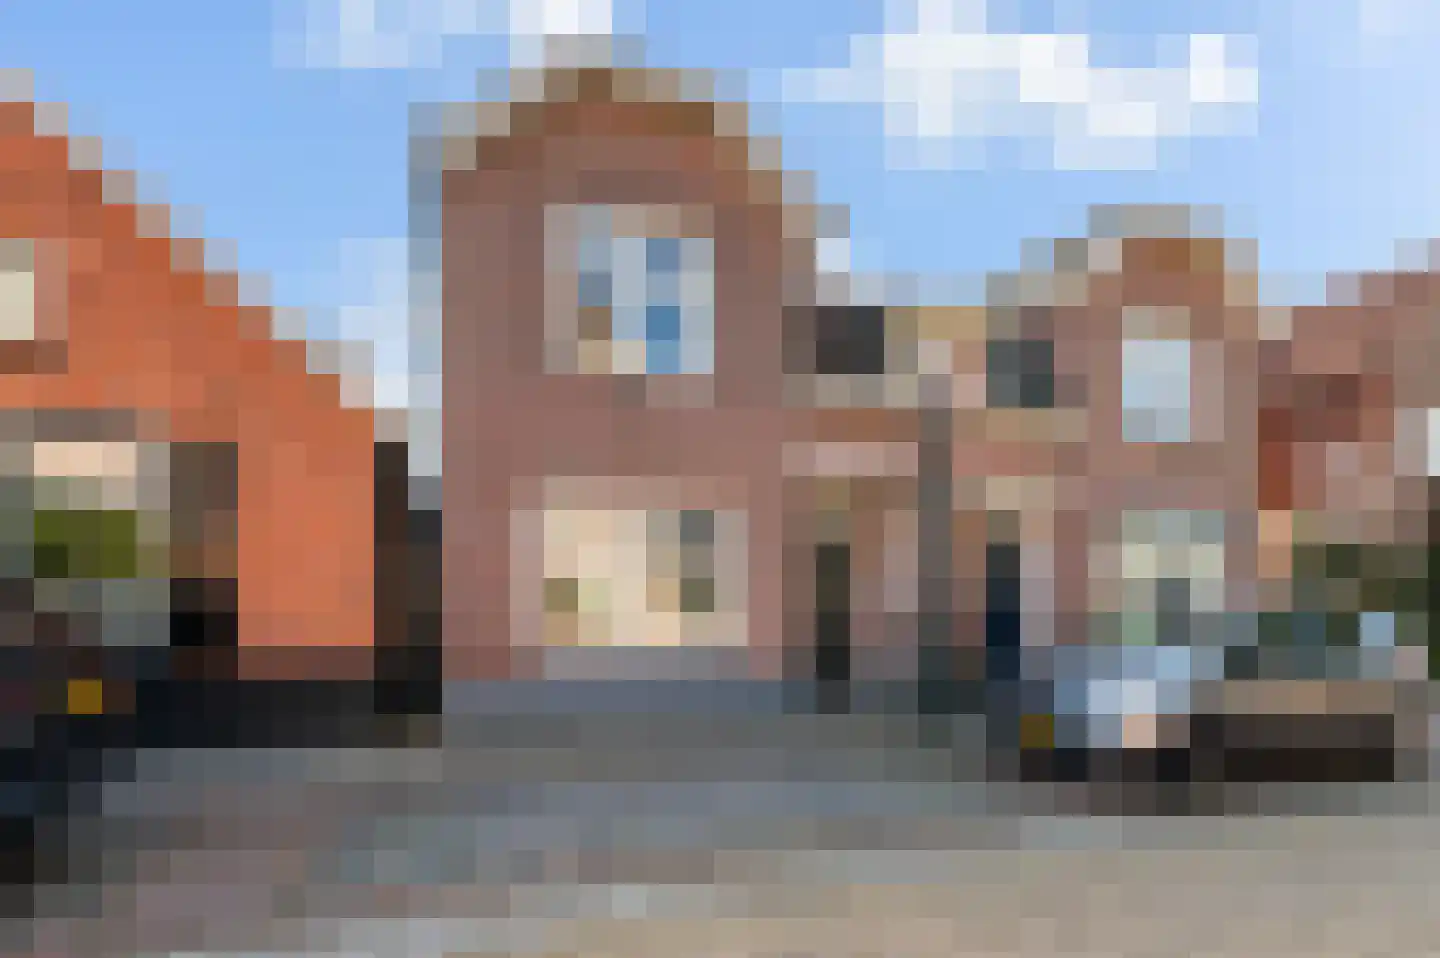
- Sold
Koppelstraat 15
7126AE Bredevoort
€ 424.015 k.k.
€ 3.719/m²
- Living area
- 114 m²
- Land area
- 365 m²
- Bedrooms
- 4
View 12 sold houses in Bredevoort
Type to search. Use arrow down and arrow up to navigate through results and press Enter to open.
Hidden search suggestions.
Compare sold homes in Bredevoort or view the current offering in this location directly.
On this page you will find recently sold homes in Bredevoort. Use this overview to better estimate selling prices, popular neighborhoods, and the local housing supply before you choose a real estate agent. Also view the current housing supply with 17 houses in Bredevoort.
7126AE Bredevoort
€ 424.015 k.k.
€ 3.719/m²
7126BZ Bredevoort
€ 275.000 k.k.
€ 3.929/m²
7126AW Bredevoort
€ 235.000 k.k.
€ 3.405/m²
7126CM Bredevoort
€ 289.500 k.k.
€ 3.146/m²
7126BX Bredevoort
€ 298.024 k.k.
€ 3.465/m²
7126CA Bredevoort
€ 449.005 k.k.
€ 4.726/m²
7126BB Bredevoort
€ 309.000 k.k.
€ 2.809/m²
7126BS Bredevoort
€ 306.000 k.k.
€ 2.732/m²
7126BJ Bredevoort
€ 185.000 k.k.
€ 5.967/m²
7126AT Bredevoort
€ 348.500 k.k.
€ 2.722/m²
7126BM Bredevoort
€ 349.000 k.k.
€ 3.116/m²
7126BJ Bredevoort
€ 224.017 k.k.
€ 0/m²
View recent sales and receive free quotes from local real estate agents. Compare more than 16 real estate agents in Bredevoort.
Selling your own home in Bredevoort? Compare real estate agents in Bredevoort or view the best real estate agents in Bredevoort as a reference for your choice.
Real estate agents make sharper offers when they know you're comparing — ask for quotes for sale or purchase.
Short answers about housing prices, sold homes and comparing real estate agents in Bredevoort.
The costs of a real estate agent in Bredevoort vary per office, property type and sales approach. In Bredevoort you can compare 16 real estate agents; therefore also look at the real estate agents in Bredevoort to better compare fees, presentation and local experience.
On this page we currently show 12 sold houses in Bredevoort from our selection. This helps you to better assess recent transactions and the local housing market.
Houses sold in Bredevoort give insight into asking prices, house types and neighborhoods where recent transactions have taken place. Compare this also with the current housing stock in Bredevoort to better understand the market.
You can use sold homes as a first market indication, but a local real estate agent can better take into account finishing, location, maintenance and current demand in Bredevoort.
Compare the 16 real estate agents in Bredevoort on local sales experience, reviews, expected yield, commission and marketing approach. View real estate agents in Bredevoort or the top 10 agents in Bredevoort to quickly discover strong offices.
View current location data on residents, WOZ development, housing stock, energy consumption, business activity and safety in Bredevoort. In 2026 were there 1.456 residents. The average WOZ value in 2025 is EUR 307.000.
These figures help to better assess and compare the housing stock in Bredevoort with recent sold homes. Orient yourself then on suitable top real estate agents in Bredevoort for sales advice in this region.
Residents
1.456
Last year: 2026
Average WOZ
EUR 307.000
Last year: 2025
Average income per person.
EUR 28.700
Source: AllNumbers
Crimes (current year)
21
Total registered
| Year | Residents |
|---|---|
| 2021 | 1.450 |
| 2022 | 1.460 |
| 2023 | 1.475 |
| 2024 | 1.470 |
| 2025 | 1.440 |
| 2026 | 1.456 |
| Year | Average WOZ |
|---|---|
| 2021 | EUR 208.000 |
| 2022 | EUR 233.000 |
| 2023 | EUR 275.000 |
| 2024 | EUR 293.000 |
| 2025 | EUR 307.000 |
Hoger
280
Praktisch
240
Middelbaar
570
Europa
70
Nederland
1.325
Buiten Europa
50
Label C
153
Label G
151
Label A
115
Label D
75
Label F
75
Label B
73
Label E
52
Label A++
6
Label A+++
6
Label A+
3
Label A++++
0
Label A+++++
0
| Year | Gas (m3) | Electricity (kWh) |
|---|---|---|
| 2020 | 1.260 | 2.740 |
| 2021 | 1.410 | 2.810 |
| 2022 | 1.110 | 2.620 |
| 2023 | 910 | 2.560 |
| 2024 | 890 | 2.650 |
Hoekwoning
Gas: 870 • Electricity: 2.380
Huurwoning
Gas: 720 • Electricity: 1.830
Koopwoning
Gas: 970 • Electricity: 2.800
Appartement
Gas: 550 • Electricity: 1.710
Tussenwoning
Gas: 820 • Electricity: 2.390
Vrijstaande woning
Gas: 1.190 • Electricity: 3.330
Twee-onder-één-kap woning
Gas: 980 • Electricity: 2.680
Total number of company establishments: 160
| Period | Crimes |
|---|---|
| jan 2026 | 3 |
| jul 2025 | 2 |
| jun 2025 | 1 |
| mei 2025 | 0 |
| mrt 2025 | 2 |
| mrt 2026 | 2 |
| nov 2024 | 0 |
| nov 2025 | 2 |
| okt 2024 | 2 |
| okt 2025 | 3 |
| sep 2024 | 1 |
| sep 2025 | 0 |
These figures give an indicative picture of safety trends in the living environment of Bredevoort.
Short answers based on current local statistics, handy for a quick comparison of the living environment.
Bredevoort telt in 2026 ongeveer 1.456 inwoners.
De gemiddelde WOZ-waarde in Bredevoort is in 2025 circa € 307.000.
Het gemiddelde inkomen per inwoner in Bredevoort ligt rond € 28.700 per jaar.
Voor het huidige jaar gaat het om ongeveer 21 geregistreerde misdrijven. Gebruik deze cijfers als indicatie en vergelijk trends per periode.
In Bredevoort komt vooral "Tussenwoningen" veel voor, met ongeveer 180 woningen.