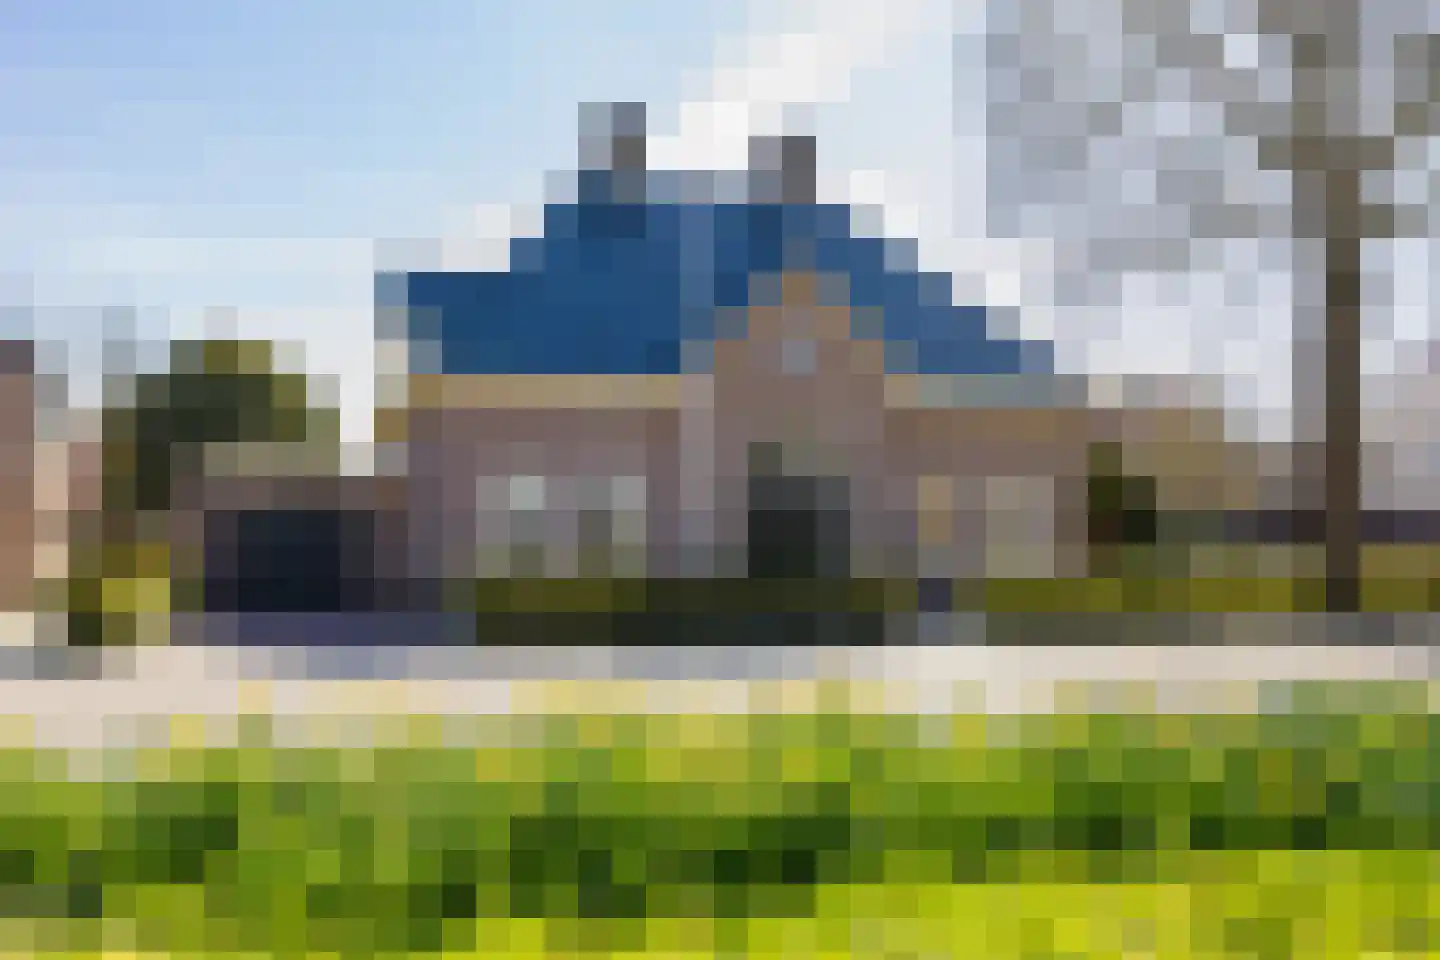
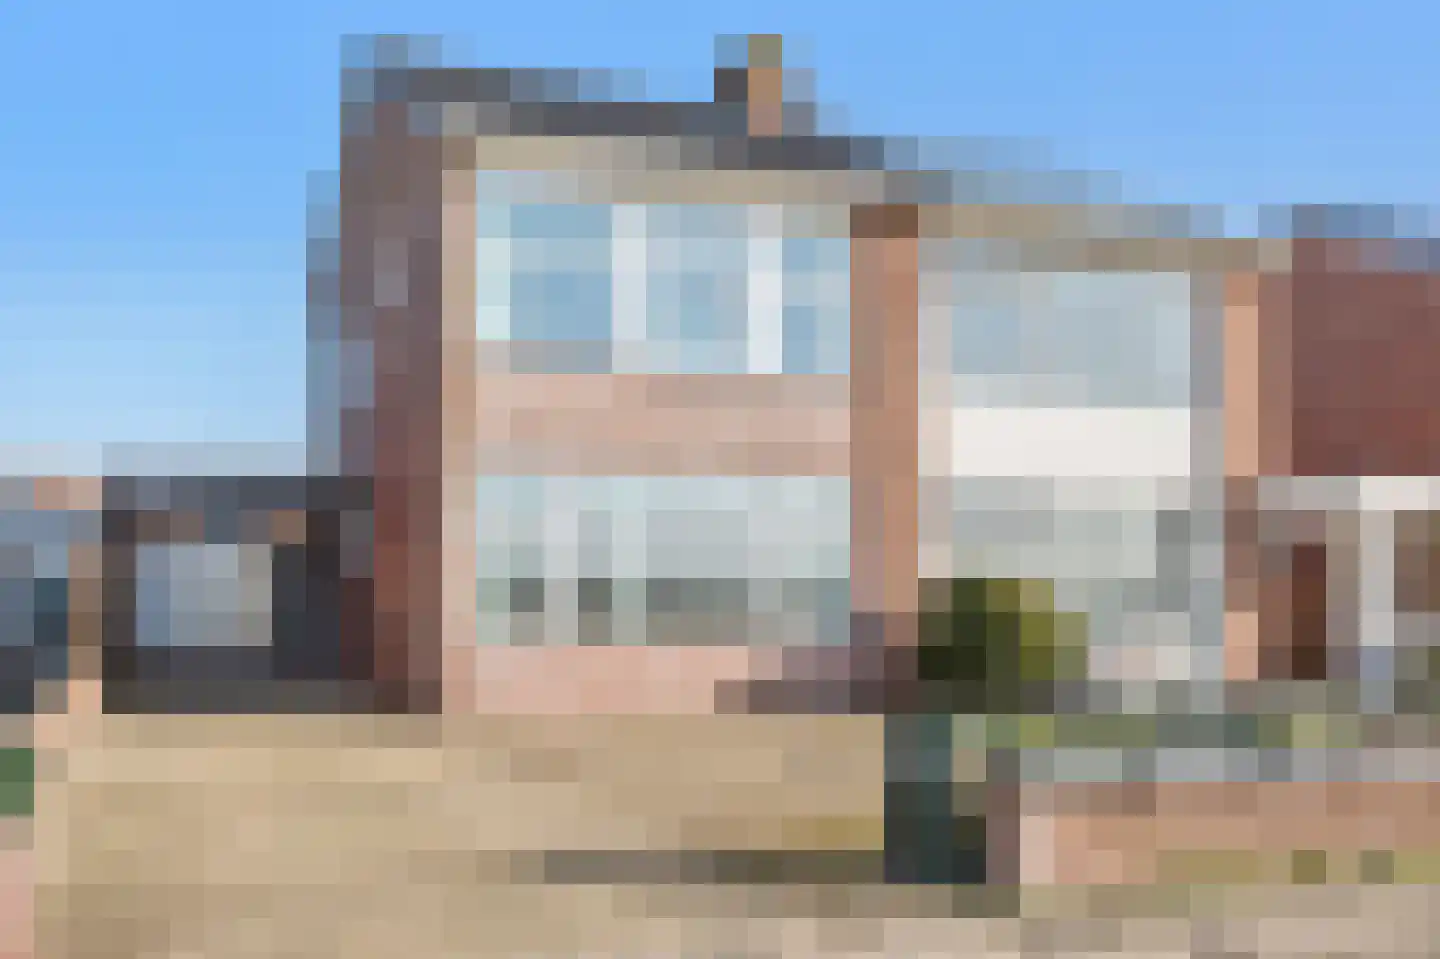
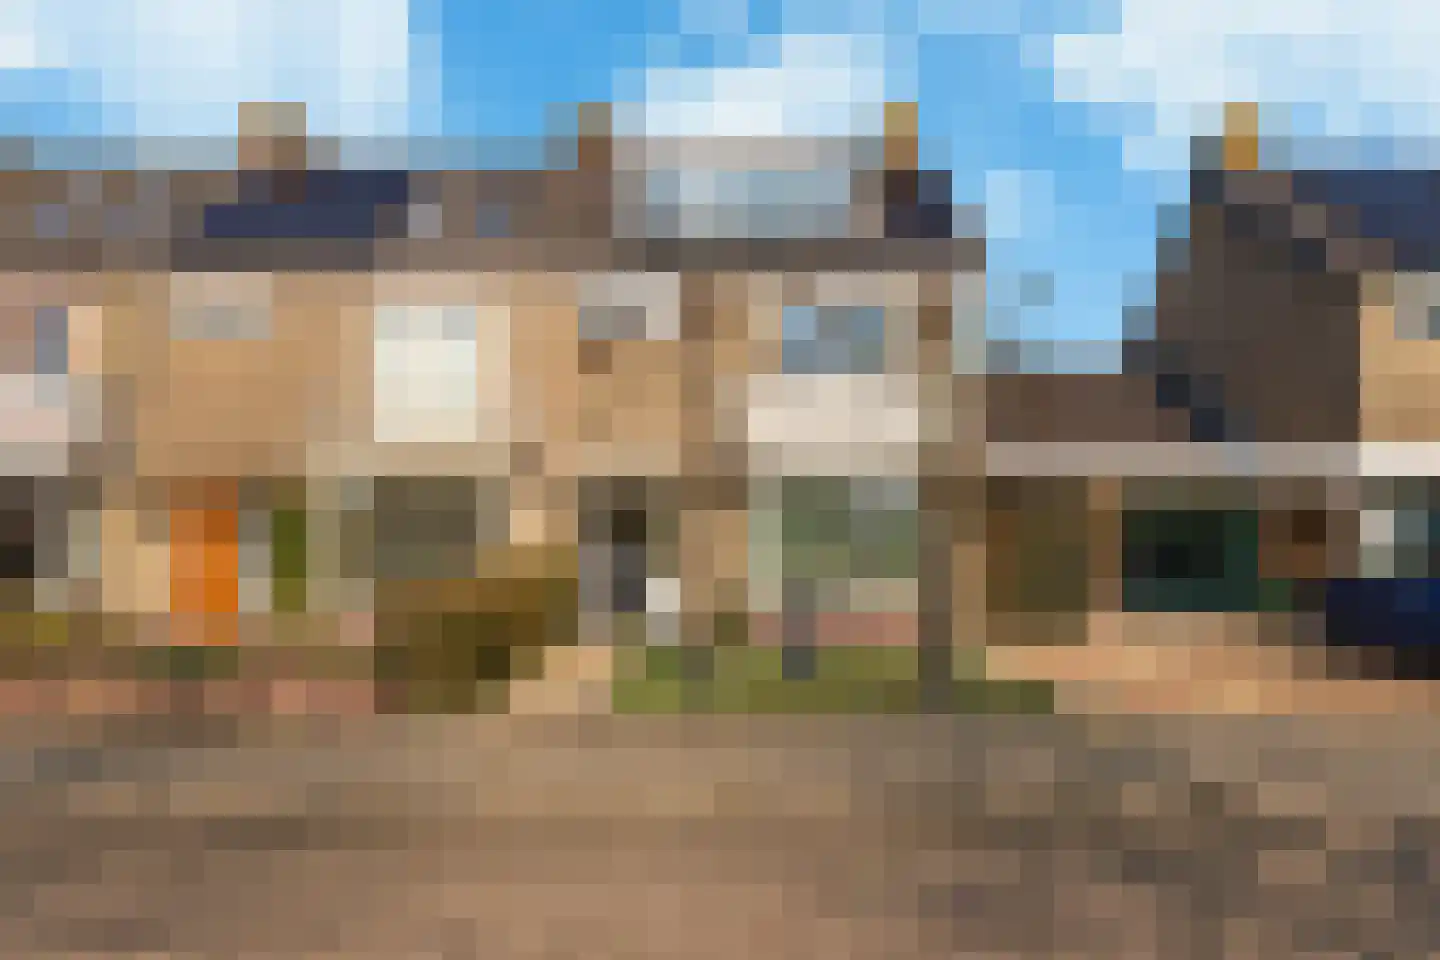
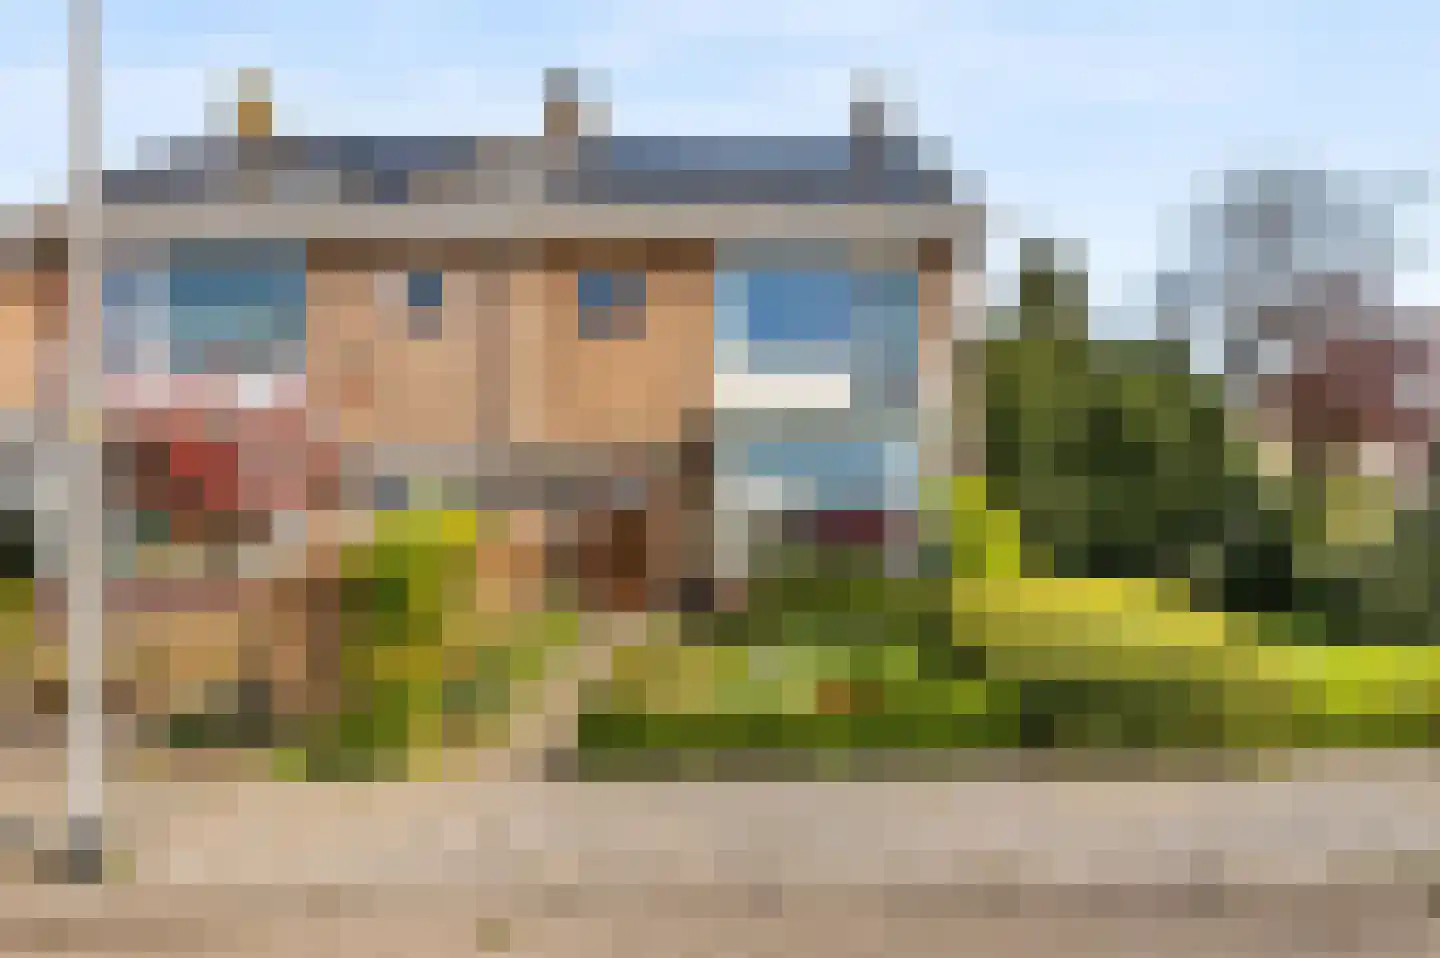
- Sold
Hoogduinweg 56
2191BA De Zilk
€ 579.000 k.k.
- Living area
- 132 m²
- Land area
- 417 m²
- Bedrooms
- 4
View 17 sold houses in De Zilk
Type to search. Use arrow down and arrow up to navigate through results and press Enter to open.
Hidden search suggestions.
Compare sold homes in De Zilk or view the current offering in this location directly.
On this page you will find recently sold homes in De Zilk. Use this overview to better estimate selling prices, popular neighborhoods, and the local housing supply before you choose a real estate agent. Also view the current housing supply with 28 houses in De Zilk.
2191BA De Zilk
€ 579.000 k.k.
2191AR De Zilk
€ 1.245.000 k.k.
€ 7.455/m²
2191AA De Zilk
€ 799.000 k.k.
€ 5.089/m²
2191AJ De Zilk
€ 775.000 k.k.
€ 4.235/m²
2191AJ De Zilk
€ 595.000 k.k.
€ 4.473/m²
2191AK De Zilk
€ 497.000 k.k.
€ 3.882/m²
2191XJ De Zilk
€ 499.000 k.k.
€ 4.536/m²
2191AP De Zilk
€ 525.000 k.k.
€ 4.101/m²
2191AV De Zilk
€ 849.000 k.k.
€ 7.318/m²
2191BM De Zilk
€ 595.000 k.k.
€ 4.343/m²
2191XT De Zilk
€ 669.000 k.k.
€ 4.778/m²
2191AD De Zilk
€ 850.000 k.k.
€ 4.047/m²
2191BZ De Zilk
€ 450.000 k.k.
€ 5.769/m²
2191AN De Zilk
€ 895.000 k.k.
€ 5.233/m²
2191BV De Zilk
€ 685.000 k.k.
€ 4.506/m²
2191XL De Zilk
€ 800.000 k.k.
€ 4.545/m²
2191AC De Zilk
€ 1.250.000 k.k.
€ 3.396/m²
View recent sales and receive free quotes from local real estate agents. Compare more than 106 real estate agents in De Zilk.
Selling your own home in De Zilk? Compare real estate agents in De Zilk or view the best real estate agents in De Zilk as a reference for your choice.
Real estate agents make sharper offers when they know you're comparing — ask for quotes for sale or purchase.
Short answers about housing prices, sold homes and comparing real estate agents in De Zilk.
The costs of a real estate agent in De Zilk vary per office, property type and sales approach. In De Zilk you can compare 106 real estate agents; therefore also look at the real estate agents in De Zilk to better compare fees, presentation and local experience.
On this page we currently show 17 sold houses in De Zilk from our selection. This helps you to better assess recent transactions and the local housing market.
Houses sold in De Zilk give insight into asking prices, house types and neighborhoods where recent transactions have taken place. Compare this also with the current housing stock in De Zilk to better understand the market.
You can use sold homes as a first market indication, but a local real estate agent can better take into account finishing, location, maintenance and current demand in De Zilk.
Compare the 106 real estate agents in De Zilk on local sales experience, reviews, expected yield, commission and marketing approach. View real estate agents in De Zilk or the top 10 agents in De Zilk to quickly discover strong offices.
View current location data on residents, WOZ development, housing stock, energy consumption, business activity and safety in De Zilk. In 2025 were there 2.405 residents. The average WOZ value in 2025 is EUR 467.000.
These figures help to better assess and compare the housing stock in De Zilk with recent sold homes. Orient yourself then on suitable top real estate agents in De Zilk for sales advice in this region.
Residents
2.405
Last year: 2025
Average WOZ
EUR 467.000
Last year: 2025
Average income per person.
EUR 32.400
Source: AllNumbers
Crimes (current year)
32
Total registered
| Year | Residents |
|---|---|
| 2021 | 2.300 |
| 2022 | 2.290 |
| 2023 | 2.355 |
| 2024 | 2.395 |
| 2025 | 2.405 |
| Year | Average WOZ |
|---|---|
| 2021 | EUR 340.000 |
| 2022 | EUR 382.000 |
| 2023 | EUR 434.000 |
| 2024 | EUR 444.000 |
| 2025 | EUR 467.000 |
Hoger
600
Praktisch
440
Middelbaar
770
Europa
170
Nederland
2.040
Buiten Europa
190
Label C
219
Label A
201
Label F
133
Label D
107
Label B
105
Label G
103
Label E
100
Label A+++
77
Label A+
13
Label A++
6
Label A++++
1
Label A+++++
0
| Year | Gas (m3) | Electricity (kWh) |
|---|---|---|
| 2020 | 1.140 | 2.990 |
| 2021 | 1.410 | 3.200 |
| 2022 | 1.100 | 2.880 |
| 2023 | 900 | 2.660 |
| 2024 | 860 | 2.760 |
Hoekwoning
Gas: 890 • Electricity: 2.670
Huurwoning
Gas: 760 • Electricity: 2.060
Koopwoning
Gas: 950 • Electricity: 2.900
Appartement
Gas: 450 • Electricity: 2.110
Tussenwoning
Gas: 780 • Electricity: 2.410
Vrijstaande woning
Gas: 1.460 • Electricity: 3.710
Twee-onder-één-kap woning
Gas: 1.090 • Electricity: 2.890
Total number of company establishments: 360
| Period | Crimes |
|---|---|
| jan 2025 | 2 |
| jan 2026 | 2 |
| jul 2025 | 3 |
| jun 2025 | 1 |
| mei 2025 | 4 |
| mrt 2025 | 3 |
| nov 2024 | 2 |
| nov 2025 | 4 |
| okt 2024 | 0 |
| okt 2025 | 3 |
| sep 2024 | 2 |
| sep 2025 | 3 |
These figures give an indicative picture of safety trends in the living environment of De Zilk.
Short answers based on current local statistics, handy for a quick comparison of the living environment.
De Zilk telt in 2025 ongeveer 2.405 inwoners.
De gemiddelde WOZ-waarde in De Zilk is in 2025 circa € 467.000.
Het gemiddelde inkomen per inwoner in De Zilk ligt rond € 32.400 per jaar.
Voor het huidige jaar gaat het om ongeveer 32 geregistreerde misdrijven. Gebruik deze cijfers als indicatie en vergelijk trends per periode.
In De Zilk komt vooral "Tussenwoningen" veel voor, met ongeveer 430 woningen.