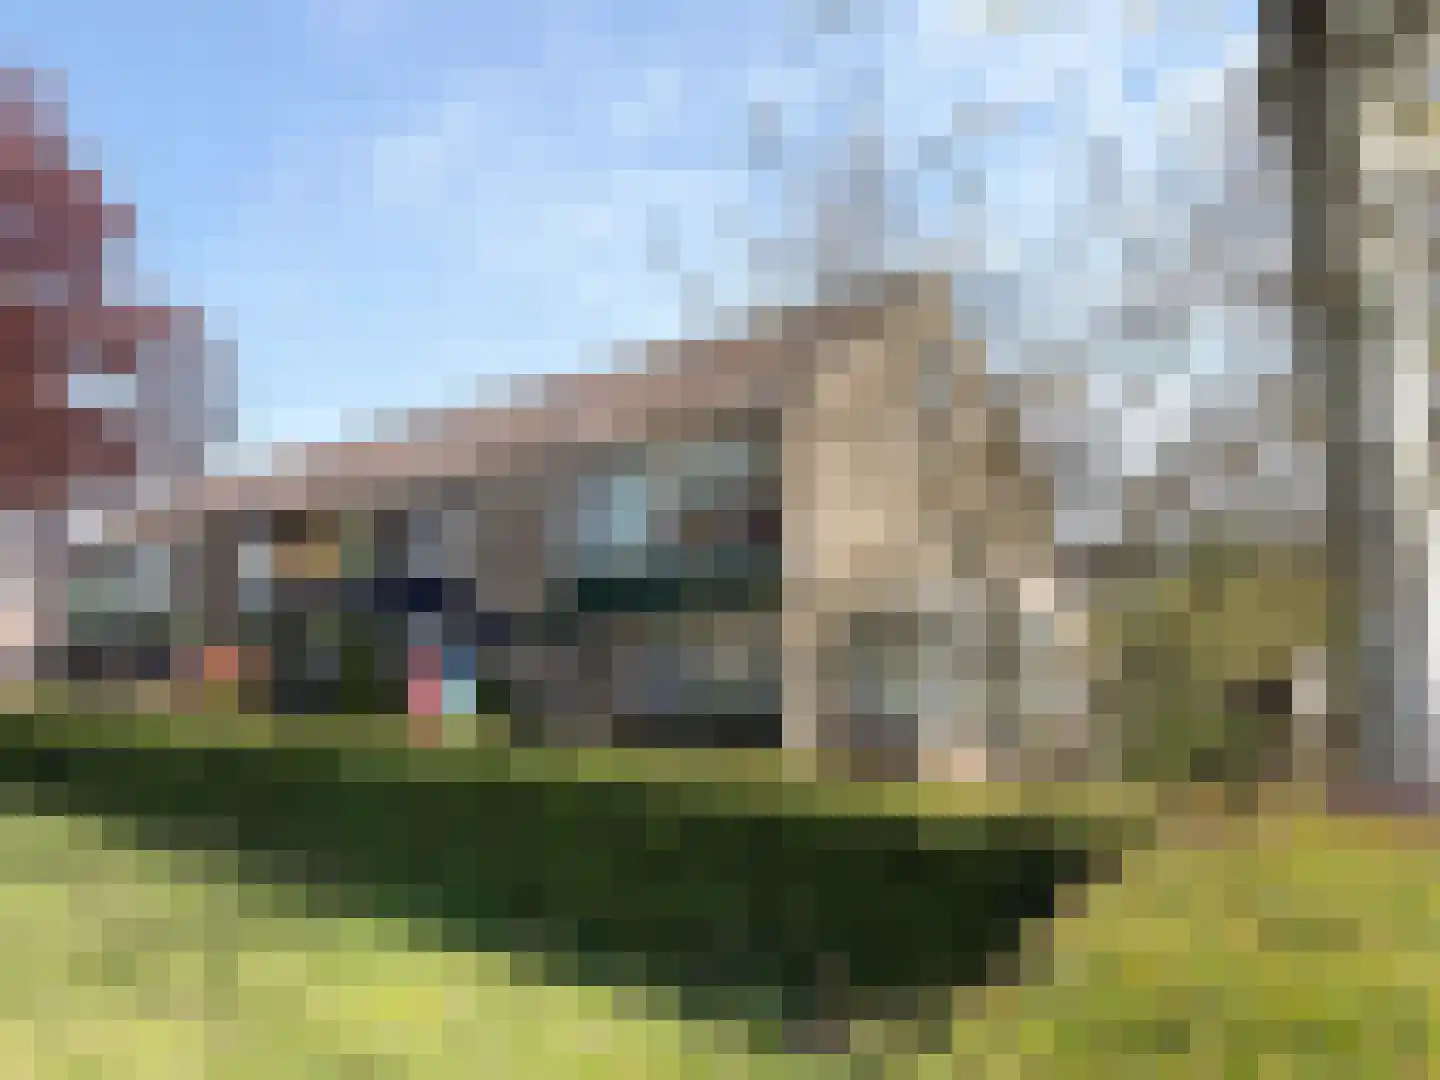
- Sold
Beusekamplaan 34
7241HC Lochem
€ 400.000 k.k.
€ 5.128/m²
- Living area
- 78 m²
- Land area
- —
- Bedrooms
- 2
View 134 sold houses in Lochem
Type to search. Use arrow down and arrow up to navigate through results and press Enter to open.
Hidden search suggestions.
Compare sold homes in Lochem or view the current offering in this location directly.
On this page you will find recently sold homes in Lochem. Use this overview to better estimate selling prices, popular neighborhoods, and the local housing supply before you choose a real estate agent. Also view the current housing supply with 225 houses in Lochem.
7241HC Lochem
€ 400.000 k.k.
€ 5.128/m²
7242CH Lochem
€ 515.000 k.k.
€ 3.011/m²
7241VW Lochem
€ 469.000 k.k.
€ 3.664/m²
7241AC Lochem
€ 369.000 k.k.
€ 3.690/m²
7241AB Lochem
€ 545.000 k.k.
€ 4.360/m²
7242AE Lochem
€ 475.000 k.k.
€ 3.025/m²
7241JK Lochem
€ 325.000 k.k.
€ 3.611/m²
7241RK Lochem
€ 275.000 k.k.
€ 3.437/m²
7242DM Lochem
€ 340.000 k.k.
€ 3.863/m²
7241SJ Lochem
€ 646.000 k.k.
€ 6.872/m²
7241HR Lochem
€ 735.000 k.k.
€ 4.867/m²
7241EJ Lochem
€ 475.000 k.k.
€ 4.656/m²
7241JG Lochem
€ 835.000 k.k.
€ 4.744/m²
7241BC Lochem
€ 420.000 k.k.
€ 4.615/m²
7241VG Lochem
€ 619.000 k.k.
€ 3.557/m²
7242MB Lochem
€ 825.000 k.k.
€ 3.634/m²
7241VE Lochem
€ 419.000 k.k.
€ 3.352/m²
7241CM Lochem
€ 575.000 k.k.
€ 4.423/m²
7241TZ Lochem
€ 1.025.000 k.k.
€ 6.212/m²
7242BV Lochem
€ 350.000 k.k.
€ 3.465/m²
7241VL Lochem
€ 519.500 k.k.
€ 3.148/m²
7242BG Lochem
€ 419.000 k.k.
€ 2.812/m²
View recent sales and receive free quotes from local real estate agents. Compare more than 15 real estate agents in Lochem.
Sold recently in Lochem? Read the sales-oriented guide sell your home in Lochem, compare sales agents in Lochem or view the top sales agents in Lochem for reference in your choice.
Real estate agents make sharper offers when they know you're comparing — ask for quotes for sale or purchase.
Short answers about housing prices, sold homes and comparing real estate agents in Lochem.
The costs of a real estate agent in Lochem vary per office, property type and sales approach. In Lochem you can compare 15 real estate agents; therefore also look at the real estate agents in Lochem to better compare fees, presentation and local experience.
On this page we currently show 134 sold houses in Lochem from our selection. This helps you to better assess recent transactions and the local housing market.
Houses sold in Lochem give insight into asking prices, house types and neighborhoods where recent transactions have taken place. Compare this also with the current housing stock in Lochem to better understand the market.
You can use sold homes as a first market indication, but a local real estate agent can better take into account finishing, location, maintenance and current demand in Lochem. Plan the next step via the guide selling a house in Lochem.
Compare the 15 real estate agents in Lochem on local sales experience, reviews, expected yield, commission and marketing approach. View real estate agents in Lochem or the top 10 agents in Lochem to quickly discover strong offices.
View current location data on residents, WOZ development, housing stock, energy consumption, business activity and safety in Lochem. In 2026 were there 13.944 residents. The average WOZ value in 2025 is EUR 391.852.
These figures help to better assess and compare the housing stock in Lochem with recent sold homes. Orient yourself then on suitable top real estate agents in Lochem for sales advice in this region.
Residents
13.944
Last year: 2026
Average WOZ
EUR 391.852
Last year: 2025
Average income per person.
EUR 30.990
Source: AllNumbers
Crimes (current year)
342
Total registered
| Year | Residents |
|---|---|
| 2021 | 13.550 |
| 2022 | 13.680 |
| 2023 | 13.880 |
| 2024 | 13.835 |
| 2025 | 13.930 |
| 2026 | 13.944 |
| Year | Average WOZ |
|---|---|
| 2021 | EUR 285.075 |
| 2022 | EUR 311.111 |
| 2023 | EUR 379.172 |
| 2024 | EUR 388.885 |
| 2025 | EUR 391.852 |
Hoger
3.280
Praktisch
2.520
Middelbaar
4.140
Europa
770
Nederland
11.495
Buiten Europa
1.670
Label C
1.967
Label A
1.825
Label B
1.294
Label G
671
Label D
613
Label F
271
Label E
254
Label A+
155
Label A+++
108
Label A++
30
Label A++++
25
Label A+++++
3
| Year | Gas (m3) | Electricity (kWh) |
|---|---|---|
| 2020 | 1.354 | 2.814 |
| 2021 | 1.542 | 2.873 |
| 2022 | 1.206 | 2.714 |
| 2023 | 988 | 2.592 |
| 2024 | 957 | 2.664 |
Hoekwoning
Gas: 914 • Electricity: 2.187
Huurwoning
Gas: 814 • Electricity: 1.871
Koopwoning
Gas: 1.088 • Electricity: 2.986
Appartement
Gas: 695 • Electricity: 1.772
Tussenwoning
Gas: 803 • Electricity: 2.104
Vrijstaande woning
Gas: 1.407 • Electricity: 3.707
Twee-onder-één-kap woning
Gas: 1.043 • Electricity: 2.832
Total number of company establishments: 1.935
| Period | Crimes |
|---|---|
| jan 2026 | 28 |
| jul 2025 | 14 |
| jun 2025 | 36 |
| mei 2025 | 42 |
| mrt 2025 | 22 |
| mrt 2026 | 21 |
| nov 2024 | 21 |
| nov 2025 | 27 |
| okt 2024 | 31 |
| okt 2025 | 25 |
| sep 2024 | 23 |
| sep 2025 | 30 |
These figures give an indicative picture of safety trends in the living environment of Lochem.
Short answers based on current local statistics, handy for a quick comparison of the living environment.
Lochem telt in 2026 ongeveer 13.944 inwoners.
De gemiddelde WOZ-waarde in Lochem is in 2025 circa € 391.852.
Het gemiddelde inkomen per inwoner in Lochem ligt rond € 30.990 per jaar.
Voor het huidige jaar gaat het om ongeveer 342 geregistreerde misdrijven. Gebruik deze cijfers als indicatie en vergelijk trends per periode.
In Lochem komt vooral "Tussenwoningen" veel voor, met ongeveer 1.750 woningen.