- Sold
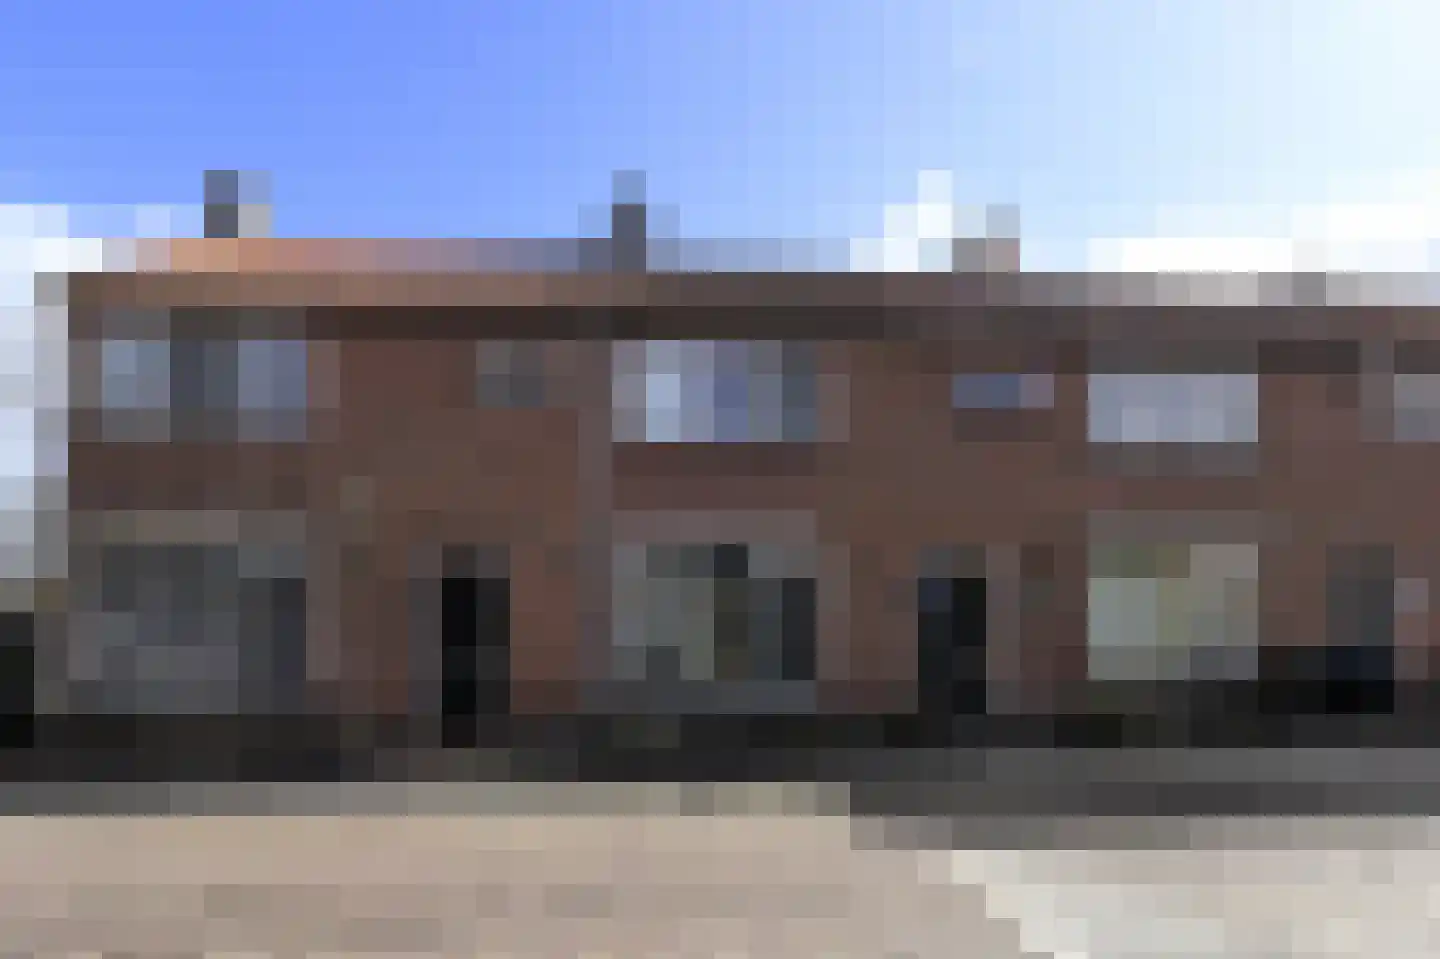
Koningin Julianaweg 14
8371WB Scheerwolde
€ 249.000 k.k.
€ 3.074/m²
- Living area
- 81 m²
- Land area
- 224 m²
- Bedrooms
- 3
View 10 sold houses in Scheerwolde
Type to search. Use arrow down and arrow up to navigate through results and press Enter to open.
Hidden search suggestions.
Compare sold homes in Scheerwolde or view the current offering in this location directly.
On this page you will find recently sold homes in Scheerwolde. Use this overview to better estimate selling prices, popular neighborhoods, and the local housing supply before you choose a real estate agent. Also view the current housing supply with 14 houses in Scheerwolde.
8371WB Scheerwolde
€ 249.000 k.k.
€ 3.074/m²
8371WK Scheerwolde
€ 1.075.000 k.k.
€ 5.023/m²
8371WJ Scheerwolde
€ 389.500 k.k.
€ 2.996/m²
8371WG Scheerwolde
Price upon request
8371WG Scheerwolde
€ 250.000 k.k.
€ 2.577/m²
8371WJ Scheerwolde
€ 545.000 k.k.
€ 3.609/m²
8371WH Scheerwolde
€ 225.000 k.k.
€ 1.844/m²
8371WP Scheerwolde
€ 1.150.000 k.k.
€ 6.182/m²
8371RA Scheerwolde
€ 825.000 k.k.
€ 4.852/m²
8371WL Scheerwolde
€ 450.000 k.k.
€ 4.545/m²
View recent sales and receive free quotes from local real estate agents. Compare more than 15 real estate agents in Scheerwolde.
Selling your own home in Scheerwolde? Compare real estate agents in Scheerwolde or view the best real estate agents in Scheerwolde as a reference for your choice.
Real estate agents make sharper offers when they know you're comparing — ask for quotes for sale or purchase.
Short answers about housing prices, sold homes and comparing real estate agents in Scheerwolde.
The costs of a real estate agent in Scheerwolde vary per office, property type and sales approach. In Scheerwolde you can compare 15 real estate agents; therefore also look at the real estate agents in Scheerwolde to better compare fees, presentation and local experience.
On this page we currently show 10 sold houses in Scheerwolde from our selection. This helps you to better assess recent transactions and the local housing market.
Houses sold in Scheerwolde give insight into asking prices, house types and neighborhoods where recent transactions have taken place. Compare this also with the current housing stock in Scheerwolde to better understand the market.
You can use sold homes as a first market indication, but a local real estate agent can better take into account finishing, location, maintenance and current demand in Scheerwolde.
Compare the 15 real estate agents in Scheerwolde on local sales experience, reviews, expected yield, commission and marketing approach. View real estate agents in Scheerwolde or the top 10 agents in Scheerwolde to quickly discover strong offices.
View current location data on residents, WOZ development, housing stock, energy consumption, business activity and safety in Scheerwolde. In 2026 were there 632 residents. The average WOZ value in 2025 is EUR 387.000.
These figures help to better assess and compare the housing stock in Scheerwolde with recent sold homes. Orient yourself then on suitable top real estate agents in Scheerwolde for sales advice in this region.
Residents
632
Last year: 2026
Average WOZ
EUR 387.000
Last year: 2025
Average income per person.
EUR 34.300
Source: AllNumbers
Crimes (current year)
11
Total registered
| Year | Residents |
|---|---|
| 2021 | 525 |
| 2022 | 535 |
| 2023 | 620 |
| 2024 | 620 |
| 2025 | 625 |
| 2026 | 632 |
| Year | Average WOZ |
|---|---|
| 2021 | EUR 242.000 |
| 2022 | EUR 264.000 |
| 2023 | EUR 328.000 |
| 2024 | EUR 365.000 |
| 2025 | EUR 387.000 |
Hoger
110
Praktisch
160
Middelbaar
220
Europa
20
Nederland
585
Buiten Europa
20
Label F
47
Label C
35
Label A++
32
Label B
29
Label G
28
Label E
24
Label D
23
Label A
18
Label A+
8
Label A+++
4
Label A++++
0
Label A+++++
0
| Year | Gas (m3) | Electricity (kWh) |
|---|---|---|
| 2020 | 1.500 | 3.140 |
| 2021 | 1.720 | 3.290 |
| 2022 | 1.350 | 3.220 |
| 2023 | 960 | 3.380 |
| 2024 | 950 | 3.600 |
Hoekwoning
Gas: 970 • Electricity: 2.280
Huurwoning
Gas: 1.090 • Electricity: 2.220
Koopwoning
Gas: 940 • Electricity: 3.580
Appartement
Gas: 1.490 • Electricity: 2.530
Tussenwoning
Gas: 790 • Electricity: 2.060
Vrijstaande woning
Gas: 960 • Electricity: 4.540
Twee-onder-één-kap woning
Gas: 1.070 • Electricity: 2.950
Total number of company establishments: 100
| Period | Crimes |
|---|---|
| jan 2026 | 0 |
| jul 2025 | 0 |
| jun 2025 | 1 |
| mei 2025 | 2 |
| mrt 2025 | 2 |
| mrt 2026 | 0 |
| nov 2024 | 2 |
| nov 2025 | 0 |
| okt 2024 | 0 |
| okt 2025 | 1 |
| sep 2024 | 0 |
| sep 2025 | 1 |
These figures give an indicative picture of safety trends in the living environment of Scheerwolde.
Short answers based on current local statistics, handy for a quick comparison of the living environment.
Scheerwolde telt in 2026 ongeveer 632 inwoners.
De gemiddelde WOZ-waarde in Scheerwolde is in 2025 circa € 387.000.
Het gemiddelde inkomen per inwoner in Scheerwolde ligt rond € 34.300 per jaar.
Voor het huidige jaar gaat het om ongeveer 11 geregistreerde misdrijven. Gebruik deze cijfers als indicatie en vergelijk trends per periode.
In Scheerwolde komt vooral "Vrijstaande woningen" veel voor, met ongeveer 130 woningen.