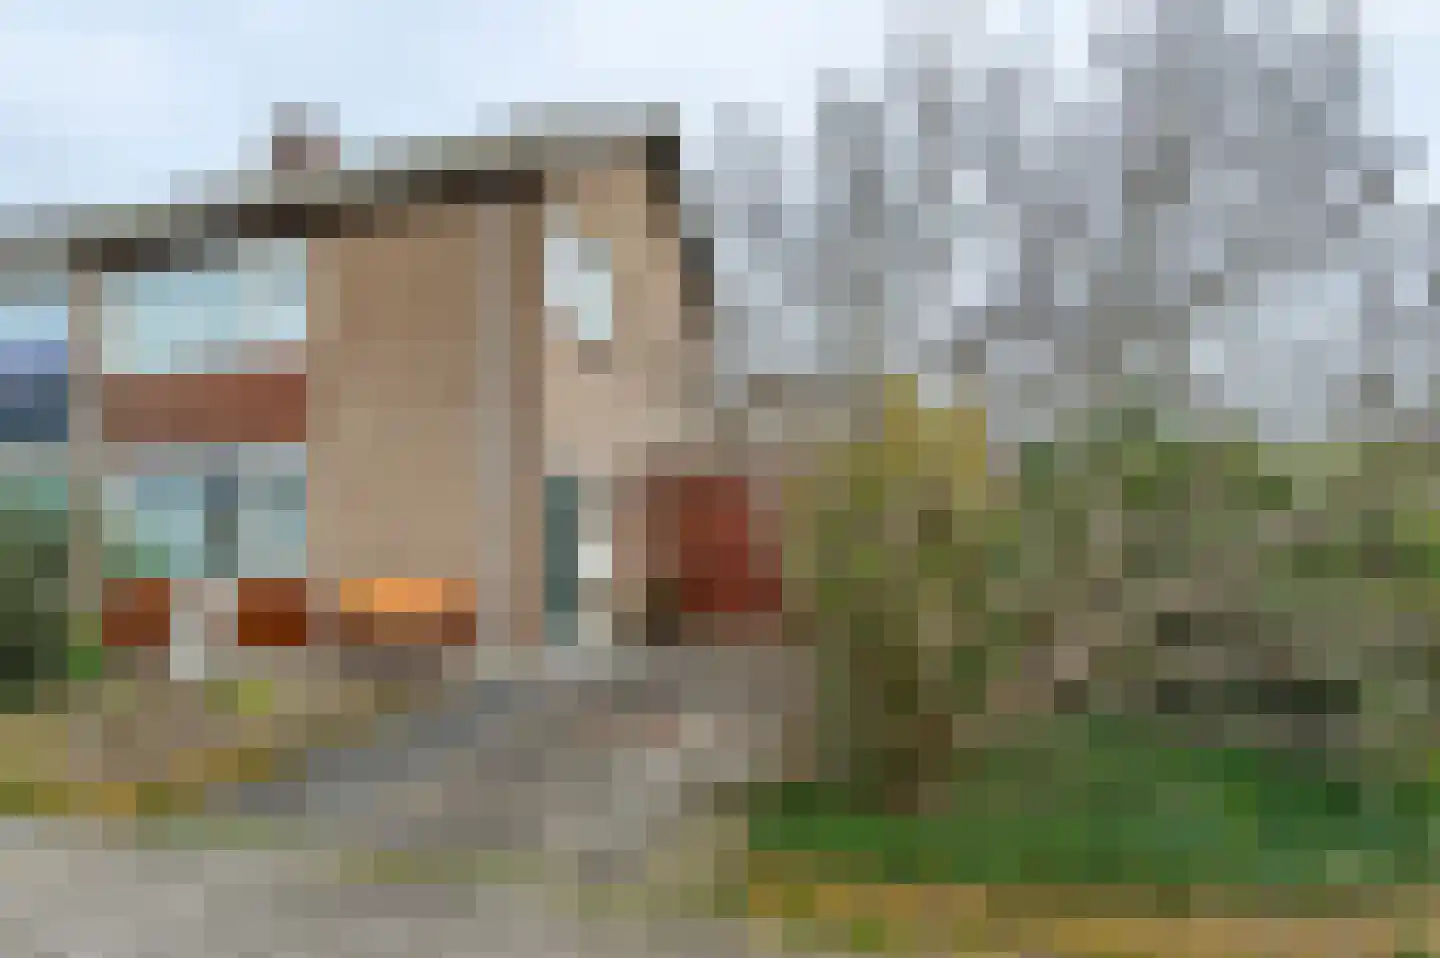
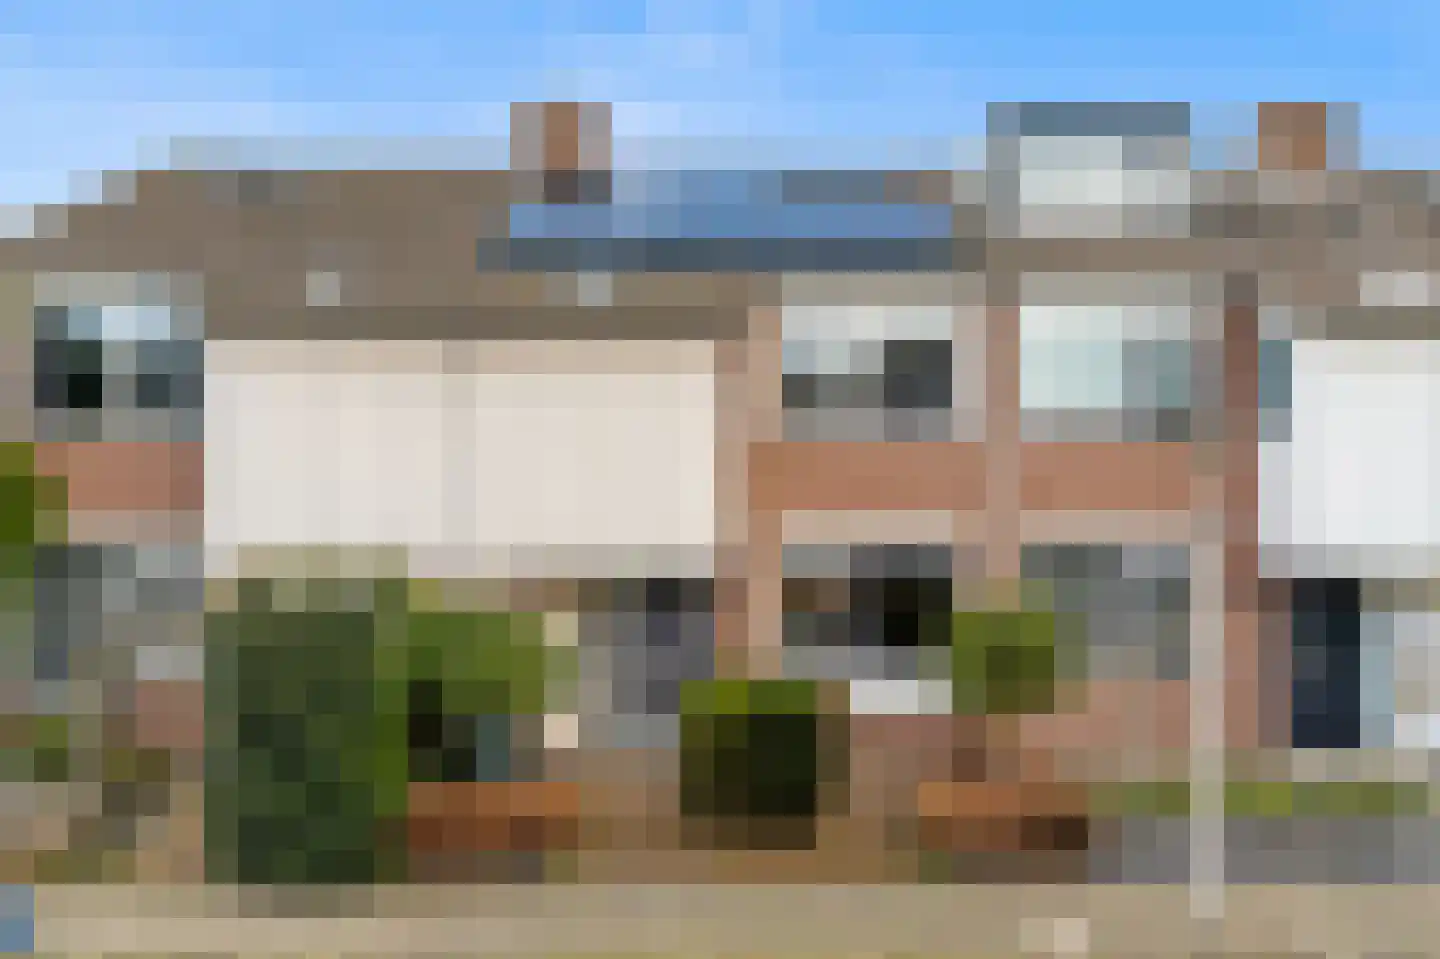
Houses sold in Schipluiden

View 15 sold houses in Schipluiden

Connected to: Vastgoed Nederland NVM Makelaars

On this page you will find recently sold homes in Schipluiden. Use this overview to better estimate selling prices, popular neighborhoods, and the local housing supply before you choose a real estate agent. Also view the current housing supply with 22 houses in Schipluiden.

Selection

Search and filter homes

Set your preferences and discover homes that suit you.

Total supply 244.606
Filters

Set price, area and other characteristics. Adjust a filter or click on Show homes. Location changes directly above.

Reset filters

You search for

  • Place Schipluiden
  • Status Sold

Sell your house in Schipluiden? Compare real estate agents

View recent sales and receive free quotes from local real estate agents. Compare more than 152 real estate agents in Schipluiden.

Free request a quote

  • Quotes in Schipluiden
  • Non-binding
  • Personal
  • Compare free rates

Selling your own home in Schipluiden? Compare real estate agents in Schipluiden or view the best real estate agents in Schipluiden as a reference for your choice.

Compare multiple quotes

Real estate agents make sharper offers when they know you're comparing — ask for quotes for sale or purchase.

Frequently asked questions about sold homes in Schipluiden

Short answers about housing prices, sold homes and comparing real estate agents in Schipluiden.

Residential and neighborhood statistics in Schipluiden

View current location data on residents, WOZ development, housing stock, energy consumption, business activity and safety in Schipluiden. In 2025 were there 4.296 residents. The average WOZ value in 2025 is EUR 472.398.

These figures help to better assess and compare the housing stock in Schipluiden with recent sold homes. Orient yourself then on suitable top real estate agents in Schipluiden for sales advice in this region.

Residents

4.296

Last year: 2025

Average WOZ

EUR 472.398

Last year: 2025

Average income per person.

EUR 34.508

Source: AllNumbers

Crimes (current year)

157

Total registered

Demographics and WOZ development

Inhabitants per year

Inhabitants per year in Schipluiden
Year Residents
2021 4.421
2022 4.390
2023 4.394
2024 4.318
2025 4.296

Annual WOZ value

WOZ value per year in Schipluiden
Year Average WOZ
2021 EUR 370.365
2022 EUR 402.955
2023 EUR 443.692
2024 EUR 460.051
2025 EUR 472.398

Composition of residents

Age build-up

65+: 1.144 0-15: 599 15-25: 492 25-45: 849 45-65: 1.212

Education level

Hoger

1.069

Praktisch

752

Middelbaar

1.176

Origin of residents (2025)

Europa

180

Nederland

3.831

Buiten Europa

281

Housing stock and construction periods

Types of homes

Hoekwoningen 360
Appartementen 326
Tussenwoningen 718
Vrijstaande woningen 355
Twee-onder-één-kap woningen 86

Construction period of buildings

Voor 1700 11
1700 tot 1900 106
1900 tot 1925 88
1925 tot 1950 102
1950 tot 1970 312
1970 tot 1980 427
1980 tot 1990 281
1990 tot 2000 113
2000 tot 2010 176
2010 tot 2020 141
2020 en later 24

Energy and sustainability

Energy label distribution

Label C

592

Label A

331

Label B

277

Label G

173

Label D

123

Label F

107

Label E

102

Label A+

22

Label A+++

9

Label A++

8

Label A++++

1

Label A+++++

0

Average energy consumption per year

Average energy consumption per year in Schipluiden
Year Gas (m3) Electricity (kWh)
2020 1.181 3.092
2021 1.381 3.194
2022 1.061 2.951
2023 939 2.751
2024 896 2.777

Consumption per house type

Hoekwoning

Gas: 769 • Electricity: 2.138

Huurwoning

Gas: 747 • Electricity: 1.978

Koopwoning

Gas: 990 • Electricity: 2.959

Appartement

Gas: 754 • Electricity: 2.097

Tussenwoning

Gas: 645 • Electricity: 2.038

Vrijstaande woning

Gas: 1.329 • Electricity: 3.947

Twee-onder-één-kap woning

Gas: 1.102 • Electricity: 2.988

Business activity in Schipluiden (2025)

Handel en HORECA 81
Nijverheid en energie 86
Zakelijke dienstverlening 163
Overheid, onderwijs en zorg 92
Landbouw, bosbouw en visserij 81
Vervoer, informatie en communicatie 42
Financiele diensten en onroerendgoed 41
Cultuur, recreatie en overige diensten 75

Total number of company establishments: 671

Recent crime statistics

Recent crime statistics in Schipluiden
Period Crimes
jan 2025 14
jan 2026 8
jul 2025 14
jun 2025 21
mei 2025 12
mrt 2025 9
nov 2024 14
nov 2025 16
okt 2024 15
okt 2025 11
sep 2024 12
sep 2025 14

These figures give an indicative picture of safety trends in the living environment of Schipluiden.

Frequently asked questions about living in Schipluiden

Short answers based on current local statistics, handy for a quick comparison of the living environment.

Hoeveel inwoners heeft Schipluiden?

Schipluiden telt in 2025 ongeveer 4.296 inwoners.

Wat is de gemiddelde WOZ-waarde in Schipluiden?

De gemiddelde WOZ-waarde in Schipluiden is in 2025 circa € 472.398.

Wat is het gemiddelde inkomen per inwoner in Schipluiden?

Het gemiddelde inkomen per inwoner in Schipluiden ligt rond € 34.508 per jaar.

Hoe veilig is wonen in Schipluiden?

Voor het huidige jaar gaat het om ongeveer 157 geregistreerde misdrijven. Gebruik deze cijfers als indicatie en vergelijk trends per periode.

Welke woningtypen komen het meest voor in Schipluiden?

In Schipluiden komt vooral "Tussenwoningen" veel voor, met ongeveer 718 woningen.

Receive free, non-binding quotes

Compare multiple real estate agents and choose the best match.