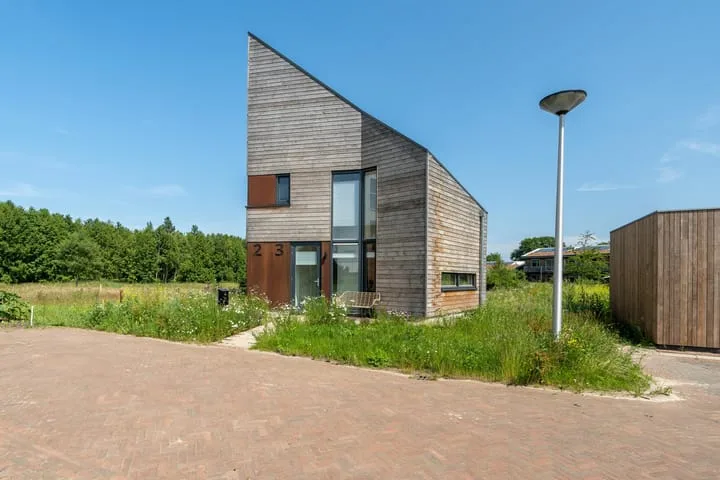
- Sold
Ten Darperweg 1 a
7981LX Diever
€ 825.000 k.k.
€ 5.221/m²
- Living area
- 158 m²
- Land area
- 6694 m²
- Bedrooms
- 4
Searching in 62 houses in Diever
Type to search. Use arrow down and arrow up to navigate through results and press Enter to open.
Hidden search suggestions.
View current properties in Diever or search targeted on street, postal code and property characteristics.
View the current housing stock in Diever and quickly filter by price, living area, rooms and more. There are currently 62 houses in this place within our selection. View also 34 sold houses in Diever for extra insight into the local housing market.
7981LX Diever
€ 825.000 k.k.
€ 5.221/m²
7981AS Diever
€ 825.000 k.k.
€ 5.221/m²
7981ED Diever
€ 375.000 k.k.
€ 7.075/m²
7981NA Diever
€ 1.050.000 k.k.
€ 5.932/m²
7981EL Diever
€ 359.500 k.k.
€ 2.899/m²
7981AD Diever
€ 439.500 k.k.
€ 1.998/m²
Get free quotes from real estate agents with local market knowledge. Compare more than 27 real estate agents in Diever.
Selling a home in Diever? Compare all real estate agents in Diever or view the top 10 real estate agents in Diever for extra context for your choice.
Real estate agents make sharper offers when they know you're comparing — ask for quotes for sale or purchase.
Practical answers about housing supply, sales and comparing real estate agents in Diever.
The costs of a real estate agent in Diever depend on commission, setup costs, property presentation and the chosen service. Compare the 27 real estate agents in Diever via the real estate agent page and request multiple quotes to compare rates and approach well.
Within our selection, we are currently showing 62 houses in Diever. View also the sold houses in Diever to compare the current offering with recent transactions.
Take into account not only price and living area but also maintenance, energy label, location, outdoor space and sales status. This way you compare houses in Diever on more than just the asking price.
A local real estate agent knows the neighborhoods, recent transactions and demand in Diever. By comparing 27 real estate agents in the region you get a better insight into prices, sales strategy and expected yield; the top 10 in Diever provides a useful starting point.
Yes, when making a sales plan, a valuation in Diever is wise. You gain insight into a realistic asking price and can then compare offers from real estate agents specifically.
View current location data on residents, WOZ development, housing stock, energy consumption, business activity and safety in Diever. In 2026 were there 2.789 residents. The average WOZ value in 2025 is EUR 408.354.
These figures help to better assess and compare the housing stock in Diever with recent sold homes. Orient yourself then on suitable top real estate agents in Diever for sales advice in this region.
Residents
2.789
Last year: 2026
Average WOZ
EUR 408.354
Last year: 2025
Average income per person.
EUR 31.622
Source: AllNumbers
Crimes (current year)
51
Total registered
| Year | Residents |
|---|---|
| 2021 | 2.604 |
| 2022 | 2.722 |
| 2023 | 2.742 |
| 2024 | 2.740 |
| 2025 | 2.752 |
| 2026 | 2.789 |
| Year | Average WOZ |
|---|---|
| 2021 | EUR 295.422 |
| 2022 | EUR 318.876 |
| 2023 | EUR 364.606 |
| 2024 | EUR 379.281 |
| 2025 | EUR 408.354 |
Hoger
592
Praktisch
441
Middelbaar
894
Europa
94
Nederland
2.519
Buiten Europa
139
Label A
409
Label C
312
Label B
301
Label G
117
Label D
99
Label F
91
Label E
29
Label A+
18
Label A+++
15
Label A++
12
Label A++++
4
Label A+++++
0
| Year | Gas (m3) | Electricity (kWh) |
|---|---|---|
| 2020 | 1.493 | 2.881 |
| 2021 | 1.678 | 2.928 |
| 2022 | 1.319 | 2.777 |
| 2023 | 1.027 | 2.702 |
| 2024 | 977 | 2.858 |
Hoekwoning
Gas: 811 • Electricity: 1.815
Huurwoning
Gas: 825 • Electricity: 1.793
Koopwoning
Gas: 1.097 • Electricity: 3.068
Appartement
Gas: 584 • Electricity: 1.835
Tussenwoning
Gas: 681 • Electricity: 1.632
Vrijstaande woning
Gas: 1.217 • Electricity: 3.318
Twee-onder-één-kap woning
Gas: 997 • Electricity: 2.569
Total number of company establishments: 350
| Period | Crimes |
|---|---|
| jan 2026 | 3 |
| jul 2025 | 1 |
| jun 2025 | 7 |
| mei 2025 | 7 |
| mrt 2025 | 7 |
| mrt 2026 | 4 |
| nov 2024 | 2 |
| nov 2025 | 3 |
| okt 2024 | 6 |
| okt 2025 | 3 |
| sep 2024 | 2 |
| sep 2025 | 3 |
These figures give an indicative picture of safety trends in the living environment of Diever.
Short answers based on current local statistics, handy for a quick comparison of the living environment.
Diever telt in 2026 ongeveer 2.789 inwoners.
De gemiddelde WOZ-waarde in Diever is in 2025 circa € 408.354.
Het gemiddelde inkomen per inwoner in Diever ligt rond € 31.622 per jaar.
Voor het huidige jaar gaat het om ongeveer 51 geregistreerde misdrijven. Gebruik deze cijfers als indicatie en vergelijk trends per periode.
In Diever komt vooral "Vrijstaande woningen" veel voor, met ongeveer 578 woningen.