Residents
46.495
Last year: 2025
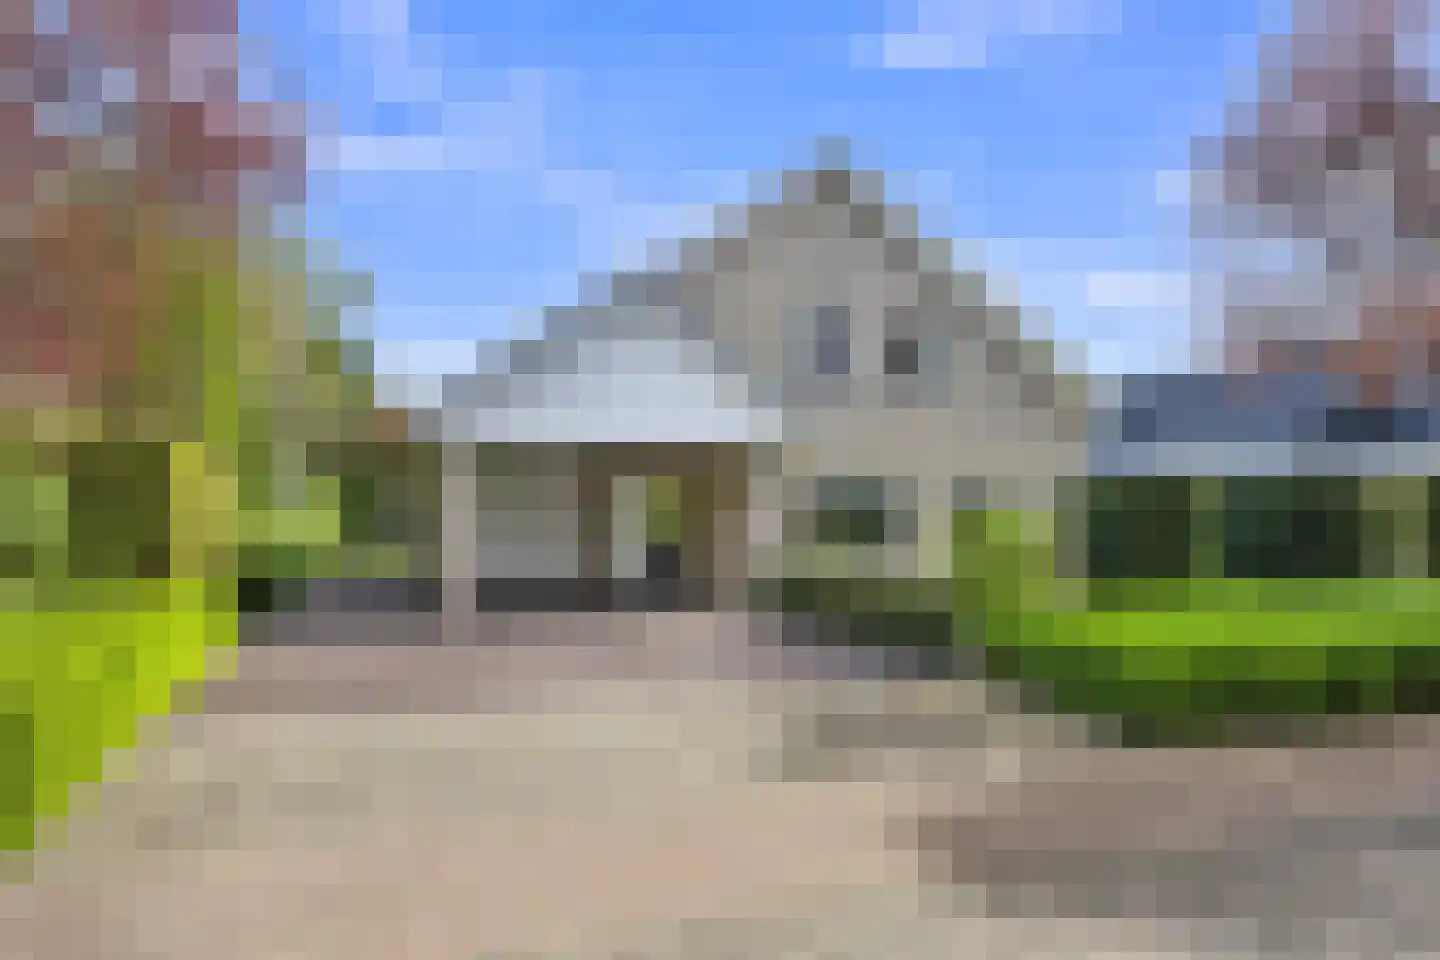
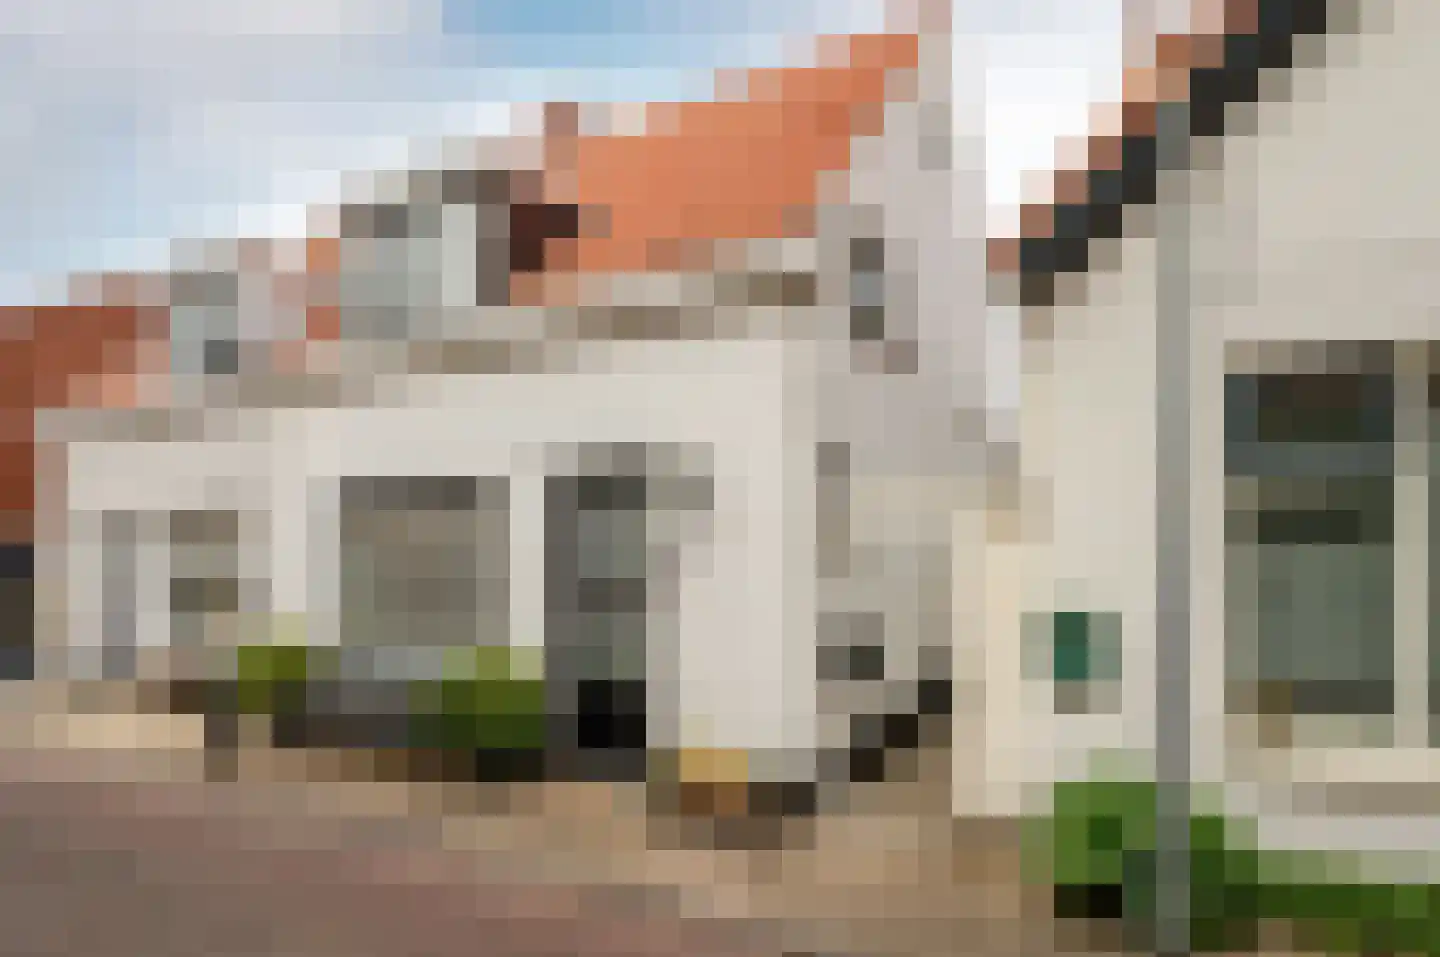
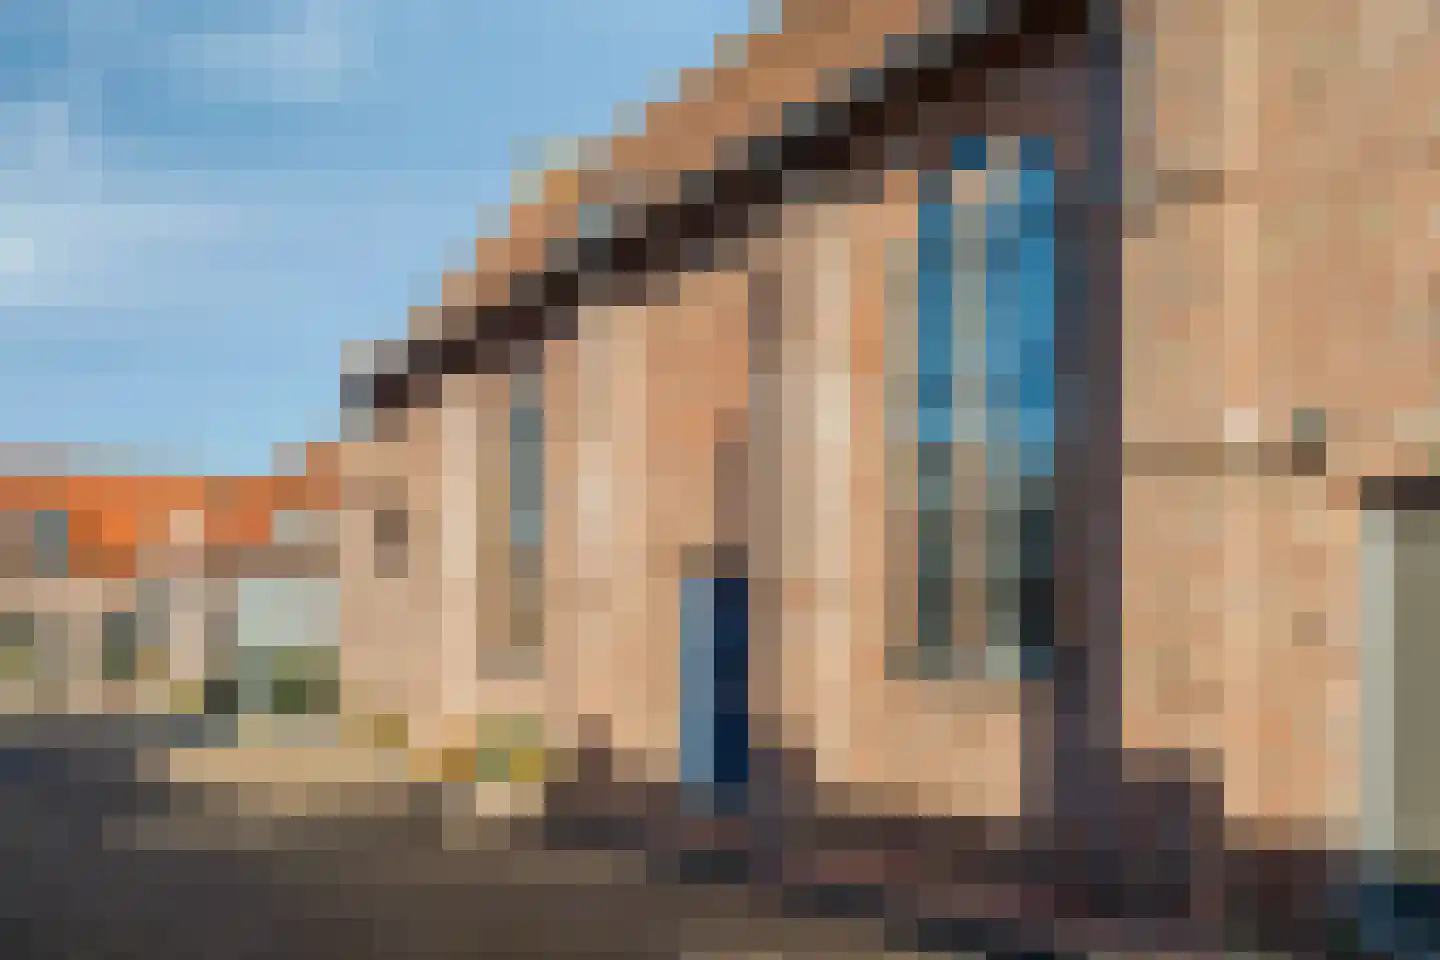
3848DK Harderwijk • Gelderland
€ 875.000 k.k.
Cost of copper (estimated): € 19.350
2% transfer tax (€ 17.500) + notary (€ 1.150) + valuation (€ 700)
Total incl. VAT: € 894.350
For this property, no detailed description is available yet.
€ 875.000
Cost of copper (estimated): € 19.350
2% transfer tax (€ 17.500) + notary (€ 1.150) + valuation (€ 700)
Total purchase (incl. p.p.): € 894.350
3,04%
Yearly
€ 43.750
Direct available
Estimated mortgage
Indicative gross monthly cost
Based on annuity and 30 year term
Indicative net monthly cost
iDisclaimer: this mortgage calculation is a simplified indication based on general assumptions. No rights can be derived from the results shown. Calculated with 10-annual interest (zonder NHG), automatically determined based on the price limit € 470.000. Source: 10-jaars rente uit mortgage_rates (28-04-2026 04:00). For non-NHG, an 80% mortgage of the market value has been used in this indication.
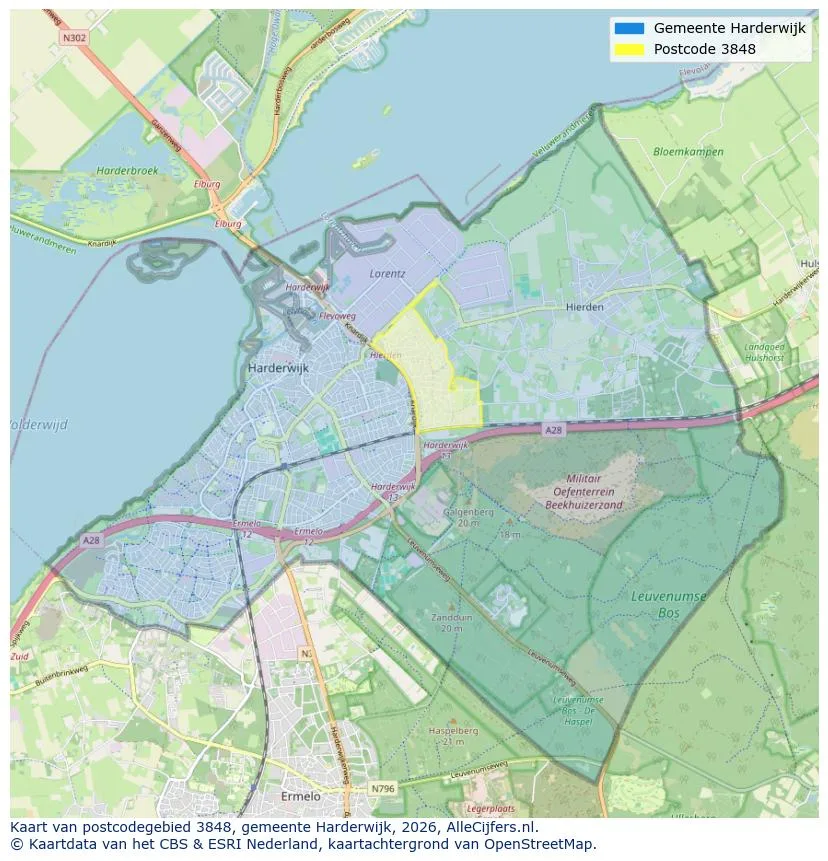
Geographic orientation and real estate agent density in Harderwijk
View current location data on residents, WOZ development, housing stock, energy consumption, business activity and safety in Harderwijk. In 2025 were there 46.495 residents. The average WOZ value in 2025 is EUR 393.126.
Residents
46.495
Last year: 2025
Average WOZ
EUR 393.126
Last year: 2025
Average income per person.
EUR 24.263
Source: AllNumbers
Crimes (current year)
1.923
Total registered
| Year | Residents |
|---|---|
| 2021 | 45.480 |
| 2022 | 45.510 |
| 2023 | 45.475 |
| 2024 | 45.945 |
| 2025 | 46.495 |
| Year | Average WOZ |
|---|---|
| 2021 | EUR 280.664 |
| 2022 | EUR 309.114 |
| 2023 | EUR 370.493 |
| 2024 | EUR 380.488 |
| 2025 | EUR 393.126 |
Hoger
10.320
Praktisch
9.490
Middelbaar
14.510
Europa
2.465
Nederland
36.280
Buiten Europa
7.765
Label A
6.906
Label C
4.968
Label B
3.569
Label D
1.386
Label E
1.239
Label F
910
Label A+
725
Label G
585
Label A+++
511
Label A++
437
Label A++++
420
Label A+++++
9
| Year | Gas (m3) | Electricity (kWh) |
|---|---|---|
| 2020 | 1.080 | 2.693 |
| 2021 | 1.224 | 2.720 |
| 2022 | 959 | 2.553 |
| 2023 | 819 | 2.433 |
| 2024 | 785 | 2.472 |
Hoekwoning
Gas: 985 • Electricity: 2.736
Huurwoning
Gas: 679 • Electricity: 1.969
Koopwoning
Gas: 932 • Electricity: 2.760
Appartement
Gas: 580 • Electricity: 1.845
Tussenwoning
Gas: 851 • Electricity: 2.475
Vrijstaande woning
Gas: 1.386 • Electricity: 4.020
Twee-onder-één-kap woning
Gas: 1.076 • Electricity: 3.210
Total number of company establishments: 6.060
| Period | Crimes |
|---|---|
| jan 2025 | 124 |
| jan 2026 | 144 |
| jul 2025 | 138 |
| jun 2025 | 149 |
| mei 2025 | 165 |
| mrt 2025 | 259 |
| nov 2024 | 146 |
| nov 2025 | 186 |
| okt 2024 | 142 |
| okt 2025 | 185 |
| sep 2024 | 169 |
| sep 2025 | 148 |
These figures give an indicative picture of safety trends in the living environment of Harderwijk.
Short answers based on current local statistics, handy for a quick comparison of the living environment.
Harderwijk telt in 2025 ongeveer 46.495 inwoners.
De gemiddelde WOZ-waarde in Harderwijk is in 2025 circa € 393.126.
Het gemiddelde inkomen per inwoner in Harderwijk ligt rond € 24.263 per jaar.
Voor het huidige jaar gaat het om ongeveer 1.923 geregistreerde misdrijven. Gebruik deze cijfers als indicatie en vergelijk trends per periode.
In Harderwijk komt vooral "Tussenwoningen" veel voor, met ongeveer 8.068 woningen.
View more homes in this location.
3841AD Harderwijk
€ 850.000 k.k.
3841CZ Harderwijk
€ 565.000 k.k.

3844CE Harderwijk
€ 435.000 k.k.

3842AA Harderwijk
€ 795.000 k.k.
3842ZD Harderwijk
€ 485.000 k.k.

3845CL Harderwijk
€ 835.000 k.k.
3842KE Harderwijk
€ 405.000 k.k.
3845DH Harderwijk
€ 439.000 k.k.
