Residents
67.370
Last year: 2025
4702SP Roosendaal • Noord-Brabant
€ 715 p/m
Rental price /m²: € 40
For this property, no detailed description is available yet.
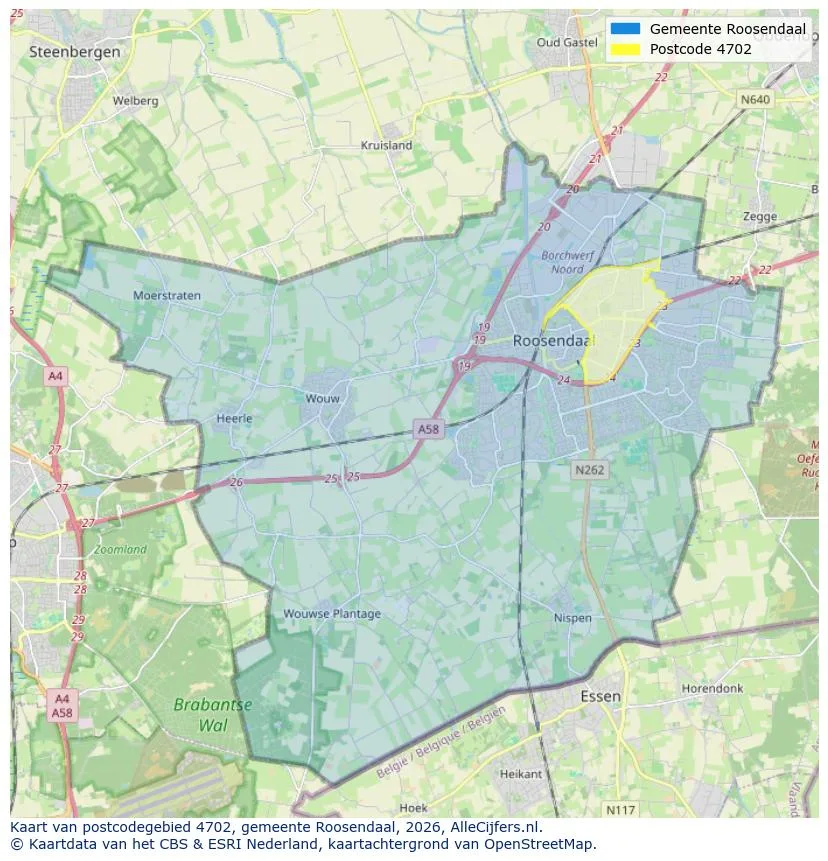
Discover where agents are active in Roosendaal
View current location data on residents, WOZ development, housing stock, energy consumption, business activity and safety in Roosendaal. In 2025 were there 67.370 residents. The average WOZ value in 2025 is EUR 308.856.
Residents
67.370
Last year: 2025
Average WOZ
EUR 308.856
Last year: 2025
Average income per person.
EUR 32.319
Source: AllNumbers
Crimes (current year)
3.924
Total registered
| Year | Residents |
|---|---|
| 2021 | 67.025 |
| 2022 | 67.000 |
| 2023 | 67.320 |
| 2024 | 67.235 |
| 2025 | 67.370 |
| Year | Average WOZ |
|---|---|
| 2021 | EUR 229.405 |
| 2022 | EUR 247.844 |
| 2023 | EUR 278.679 |
| 2024 | EUR 285.790 |
| 2025 | EUR 308.856 |
Hoger
13.720
Praktisch
15.300
Middelbaar
21.230
Europa
8.305
Nederland
45.380
Buiten Europa
13.685
Label C
9.297
Label A
6.760
Label B
5.831
Label D
3.028
Label G
2.019
Label E
2.016
Label F
1.491
Label A+
1.007
Label A++
484
Label A+++
378
Label A++++
183
Label A+++++
10
| Year | Gas (m3) | Electricity (kWh) |
|---|---|---|
| 2020 | 1.149 | 2.756 |
| 2021 | 1.287 | 2.777 |
| 2022 | 1.007 | 2.619 |
| 2023 | 870 | 2.482 |
| 2024 | 854 | 2.532 |
Hoekwoning
Gas: 999 • Electricity: 2.661
Huurwoning
Gas: 724 • Electricity: 1.964
Koopwoning
Gas: 973 • Electricity: 2.814
Appartement
Gas: 496 • Electricity: 1.732
Tussenwoning
Gas: 868 • Electricity: 2.461
Vrijstaande woning
Gas: 1.412 • Electricity: 3.648
Twee-onder-één-kap woning
Gas: 1.146 • Electricity: 2.964
Total number of company establishments: 8.175
| Period | Crimes |
|---|---|
| jan 2026 | 300 |
| jul 2025 | 315 |
| jun 2025 | 312 |
| mei 2025 | 297 |
| mrt 2025 | 342 |
| mrt 2026 | 339 |
| nov 2024 | 335 |
| nov 2025 | 394 |
| okt 2024 | 336 |
| okt 2025 | 364 |
| sep 2024 | 306 |
| sep 2025 | 279 |
These figures give an indicative picture of safety trends in the living environment of Roosendaal.
Short answers based on current local statistics, handy for a quick comparison of the living environment.
Roosendaal telt in 2025 ongeveer 67.370 inwoners.
De gemiddelde WOZ-waarde in Roosendaal is in 2025 circa € 308.856.
Het gemiddelde inkomen per inwoner in Roosendaal ligt rond € 32.319 per jaar.
Voor het huidige jaar gaat het om ongeveer 3.924 geregistreerde misdrijven. Gebruik deze cijfers als indicatie en vergelijk trends per periode.
In Roosendaal komt vooral "Tussenwoningen" veel voor, met ongeveer 12.036 woningen.
View more homes in this location.

4702SP Roosendaal
€ 715 p/m
€ 40/m²
4701AX Roosendaal
€ 279.000 k.k.
€ 4.292/m²

4703GB Roosendaal
€ 1.030 p/m
€ 17/m²

4707CG Roosendaal
€ 359.000 k.k.
4703HA Roosendaal
€ 299.000 k.k.
4707MB Roosendaal
€ 399.500 k.k.

4706CB Roosendaal
€ 575.000 k.k.

4701HV Roosendaal
€ 315.000 k.k.
