
Residents
795
Last year: 2025
5844AR Stevensbeek • Noord-Brabant
€ 1.145.000 k.k.
Cost of copper (estimated): € 24.750
2% transfer tax (€ 22.900) + notary (€ 1.150) + valuation (€ 700)
Total incl. VAT: € 1.169.750
Purchase price /m²: € 4.164
Op een fraai gelegen landelijke woonlocatie, aan de rand van het dorp, ligt dit in 2024 gebouwde landhuis. De woning combineert ruimte, comfort en duurzaamheid, voorzien van royale woonvertrekken, veel lichtinval en een luxe, hoogwaardige afwerking. Levensloopbestendig wonen is uitstekend mogelijk dankzij de slaapkamer en badkamer op de begane grond. Met maar liefst vijf slaapkamers is deze woning tevens zeer geschikt voor grotere gezinnen, thuiswerken of het combineren van wonen en hobby’s. De fraai aangelegde achtertuin biedt volop privacy en rust. Het multifunctionele bijgebouw is geschikt voor diverse doeleinden, zoals werken aan huis, hobbyruimte of gastenverblijf. Kortom: een comfortabele en ruime nieuwbouwwoning, energiezuinig en hoogwaardig afgewerkt. Indeling: Begane grond: hal/ entree met meterkast en toilet ingericht met wandcloset en fonteintje. Een aan de voorzijde van de woning gesitueerde slaapkamer met badkamer voorzien van een wastafel, inloopdouche en wandtoilet. Een zeer ruim opgezette woonkamer met centraal gelegen riante keuken voorzien van een kookeiland en luxe en complete inrichting. Vanuit zowel de woonkamer, als woonkeuken is er middels een schuifpui toegang tot de fraai aangelegde achtertuin. 1e verdieping: overloop, 3 slaapkamers waarvan 1 riante ouderslaapkamer met een walk-in closet. Werkkamer en een badkamer voorzien van een ligbad, inloopdouche, wandtoilet en wastafel. 2e verdieping: via een vaste trap bereikbare zolderverdieping welke nu ingericht is met 2 slaapkamers en een bergzolder. Het vrijstaande bijgebouw is voor meerdere doeleinden te gebruiken, zoals mantelzorg of praktijk of kantoor aan huis. De voorbereidingen zijn aanwezig voor een keuken- en badkamerinrichting en verder 2 (slaap-)kamers. Diverse gegevens: De keukenopstelling is voorzien van een inductiekookplaat met geïntegreerde afzuiging, 2 combiovens, vaatwasser, koelkast en aparte vrieskast. Uitstekend geïsoleerde en hoogwaardig gebouwde woning. Er is een warmtepomp van Nefit aanwezig, met een boilervat van 300 liter. De woning is voorzien van 30 zonnepanelen. Een onder architectuur aangelegde achtertuin. Er is een grondwaterpuls aanwezig t.b.v. de beregening van de tuin. Stevensbeek is op korte afstand gelegen van Sint-Anthonis en Overloon, waar alle dagelijkse voorzieningen te vinden zijn. Nijmegen en Venlo zijn via de A73 goed bereikbaar. Belangrijkste vaste lasten (volgens opgave huidige gebruiker): Onroerendezaakbelasting: € 859,98 per jaar Rioolheffing: € 271,44 per jaar Afvalstoffenheffing: € 271,80 per jaar Waterschapslasten: € 524,00 per jaar
€ 1.145.000
Cost of copper (estimated): € 24.750
2% transfer tax (€ 22.900) + notary (€ 1.150) + valuation (€ 700)
Total purchase (incl. p.p.): € 1.169.750
3,21%
Yearly
€ 57.250
Direct available
Estimated mortgage
Indicative gross monthly cost
Based on annuity and 30 year term
Indicative net monthly cost
iDisclaimer: this mortgage calculation is a simplified indication based on general assumptions. No rights can be derived from the results shown. Calculated with 10-annual interest (zonder NHG), automatically determined based on the price limit € 470.000. Source: 10-jaars rente uit mortgage_rates (09-06-2026 03:45). For non-NHG, an 80% mortgage of the market value has been used in this indication.
2 douches, 2 toiletten, 2 wastafels, ligbad, en wastafelmeubel
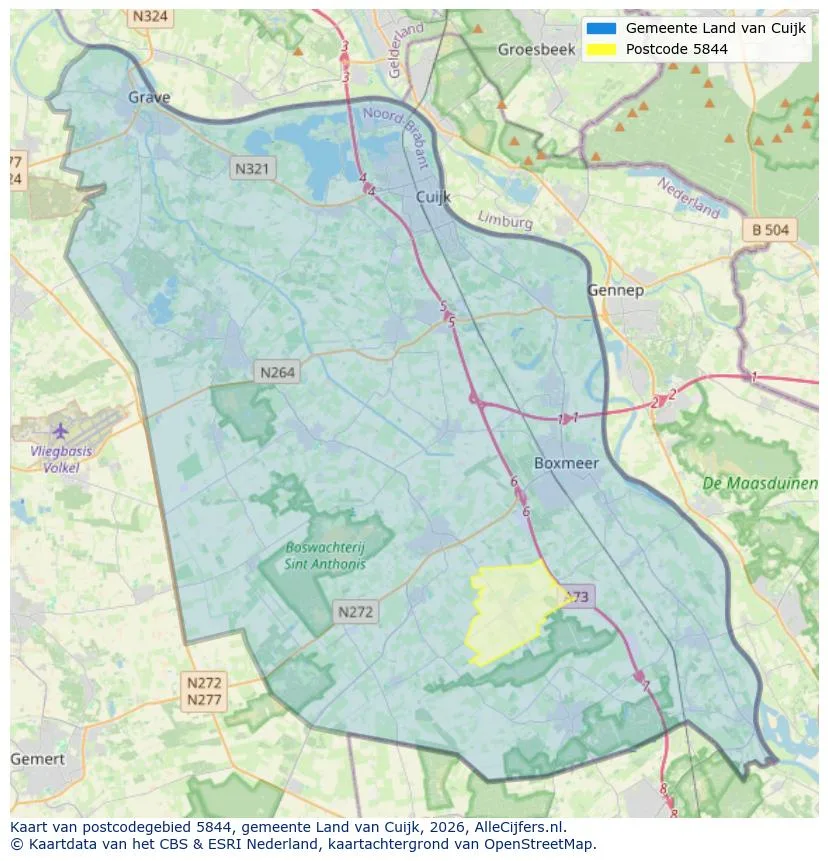
Explore Stevensbeek and the surrounding areas
View current location data on residents, WOZ development, housing stock, energy consumption, business activity and safety in Stevensbeek. In 2025 were there 795 residents. The average WOZ value in 2025 is EUR 425.000.
Residents
795
Last year: 2025
Average WOZ
EUR 425.000
Last year: 2025
Average income per person.
EUR 33.200
Source: AllNumbers
Crimes (current year)
19
Total registered
| Year | Residents |
|---|---|
| 2021 | 715 |
| 2022 | 715 |
| 2023 | 770 |
| 2024 | 780 |
| 2025 | 795 |
| Year | Average WOZ |
|---|---|
| 2021 | EUR 312.000 |
| 2022 | EUR 346.000 |
| 2023 | EUR 378.000 |
| 2024 | EUR 404.000 |
| 2025 | EUR 425.000 |
Hoger
200
Praktisch
130
Middelbaar
300
Europa
45
Nederland
685
Buiten Europa
70
Label A
75
Label C
52
Label A+++
40
Label D
39
Label F
37
Label G
35
Label B
34
Label E
16
Label A++
16
Label A+
9
Label A++++
2
Label A+++++
0
| Year | Gas (m3) | Electricity (kWh) |
|---|---|---|
| 2020 | 1.730 | 4.030 |
| 2021 | 1.820 | 4.170 |
| 2022 | 1.360 | 3.930 |
| 2023 | 950 | 3.740 |
| 2024 | 960 | 3.700 |
Hoekwoning
Gas: 350 • Electricity: 3.490
Huurwoning
Gas: 530 • Electricity: 2.330
Koopwoning
Gas: 1.040 • Electricity: 4.050
Appartement
Gas: 500 • Electricity: 2.060
Tussenwoning
Gas: 170 • Electricity: 2.950
Vrijstaande woning
Gas: 1.230 • Electricity: 4.220
Twee-onder-één-kap woning
Gas: 800 • Electricity: 3.470
Total number of company establishments: 135
| Period | Crimes |
|---|---|
| jan 2025 | 1 |
| jan 2026 | 5 |
| jul 2025 | 2 |
| jun 2025 | 1 |
| mei 2025 | 0 |
| mrt 2025 | 3 |
| nov 2024 | 1 |
| nov 2025 | 0 |
| okt 2024 | 0 |
| okt 2025 | 0 |
| sep 2024 | 2 |
| sep 2025 | 4 |
These figures give an indicative picture of safety trends in the living environment of Stevensbeek.
Short answers based on current local statistics, handy for a quick comparison of the living environment.
Stevensbeek telt in 2025 ongeveer 795 inwoners.
De gemiddelde WOZ-waarde in Stevensbeek is in 2025 circa € 425.000.
Het gemiddelde inkomen per inwoner in Stevensbeek ligt rond € 33.200 per jaar.
Voor het huidige jaar gaat het om ongeveer 19 geregistreerde misdrijven. Gebruik deze cijfers als indicatie en vergelijk trends per periode.
In Stevensbeek komt vooral "Vrijstaande woningen" veel voor, met ongeveer 206 woningen.
View more homes in this location.
5844AJ Stevensbeek
€ 1.095.000 k.k.
€ 3.422/m²
5844AS Stevensbeek
€ 665.000 k.k.
€ 3.958/m²
5844AX Stevensbeek
€ 415.000 k.k.
€ 3.347/m²

5844AL Stevensbeek
€ 430.000 k.k.
€ 4.387/m²

5844AV Stevensbeek
€ 325.000 k.k.
€ 4.012/m²

5844AV Stevensbeek
€ 649.000 k.k.
€ 0/m²

5844AV Stevensbeek
€ 395.000 k.k.
€ 0/m²

5844AS Stevensbeek
€ 525.000
€ 3.750/m²
