- Under consideration
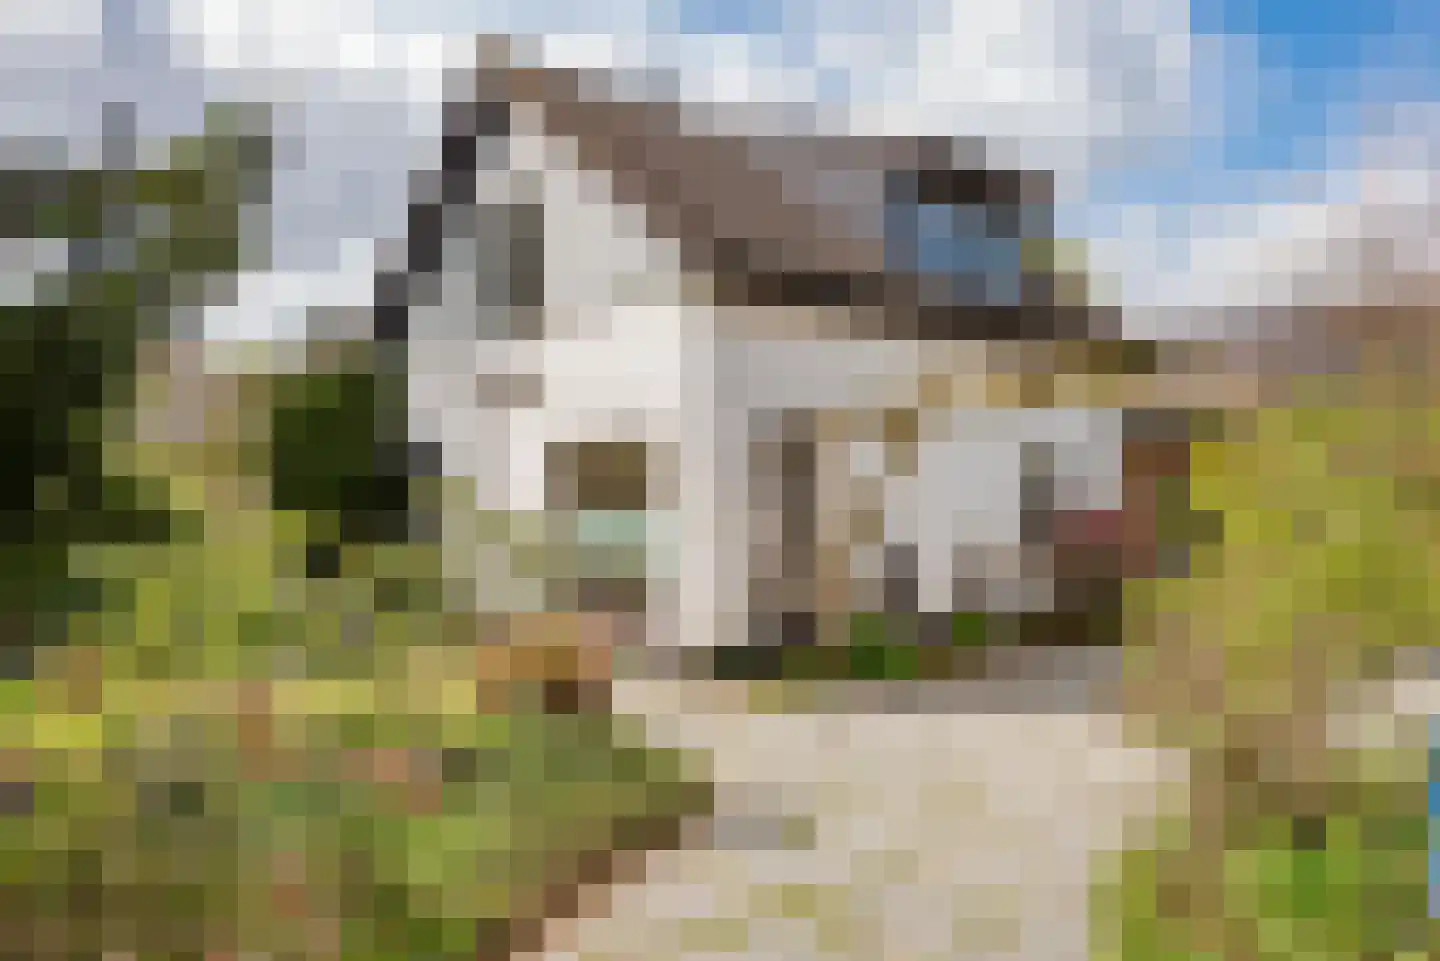
Harm Aartsweg 10
8095RE 't Loo Oldebroek
€ 700.000 k.k.
€ 3.004/m²
C
Save as favorite
- Living area
- 233 m²
- Land area
- 1140 m²
- Bedrooms
- 8