Residents
82.410
Last year: 2025
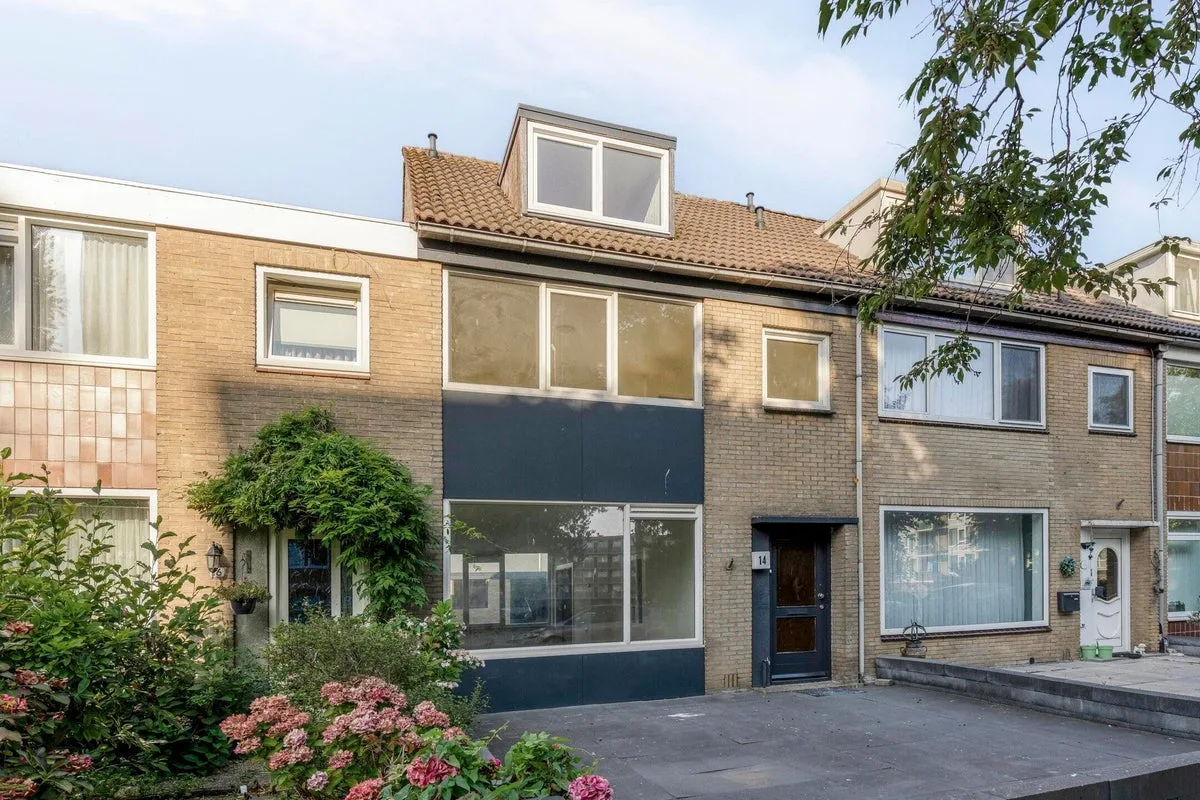
1503TN Zaandam • Noord-Holland
€ 450.000 k.k.
Cost of copper (estimated): € 10.850
2% transfer tax (€ 9.000) + notary (€ 1.150) + valuation (€ 700)
Total incl. VAT: € 460.850
Purchase price /m²: € 3.846
ENGLISH BELOW Wonen met ruimte, rust en comfort aan de Rode Zee! Aan de Rode Zee 20 in Zaandam staat deze royale eengezinswoning met een grote, lichte woonkamer en een open keuken die samen zorgen voor een fijne leefruimte. Het huis voelt direct prettig aan: ruim, praktisch en ideaal voor wie comfortabel wil wonen in een rustige, kindvriendelijke omgeving. Op de eerste verdieping bevinden zich drie ruime slaapkamers en een grote badkamer. De tweede verdieping biedt nog eens twee kamers, waarvan één is ingericht als washok en de andere uitstekend geschikt is als slaap- of werkkamer. Daarmee beschikt de woning over volop flexibiliteit voor een gezin, thuiswerk of logees. Ook buiten is het goed geregeld. Achter de tuin staat een aparte garage, waar eenvoudig elektra en water naartoe te trekken zijn, wat de gebruiksmogelijkheden nog verder vergroot. De woning ligt in een fijne buurt met dagelijkse voorzieningen dichtbij. Hier woon je rustig, met veel ruimte om je heen en alles wat je nodig hebt binnen handbereik. Kenmerken: - Woonoppervlakte ca. 117 m². - Perceeloppervlakte 157 m² eigen grond. - Grote, royale woonkamer met open keuken. - 1e verdieping: 3 slaapkamers en een grote badkamer. - 2e verdieping: 2 kamers, waarvan 1 washok en 1 slaap-/werkkamer. - Energielabel C. - Aparte garage achter de tuin, mee te leveren tegen meerprijs van € 40.000. Nieuwsgierig geworden? Plan snel een bezichtiging en ontdek zelf de ruimte, rust en mogelijkheden van deze woning aan de Rode Zee. De informatie in deze presentatie is met zorg samengesteld, maar kan afwijken van de werkelijkheid. Aan deze tekst kunnen geen rechten worden ontleend. ENGLISH Space, comfort and a great location on Rode Zee At Rode Zee 20 in Zaandam, you will find a spacious family home with a bright, generous living room and an open kitchen that form the heart of the house. The home offers a practical layout, plenty of natural light and a comfortable feel throughout, making it an ideal place for everyday family living. On the first floor, there are three spacious bedrooms and a large bathroom. The second floor offers two additional rooms, one currently used as a laundry room and the other perfectly suited as a sleeping room or home office, giving the house plenty of flexibility for different living needs. Behind the garden, you will find a separate garage, which can be supplied with electricity and water, adding even more convenience and potential use. The home is located in a quiet and pleasant neighbourhood with daily amenities nearby, so you can enjoy both peace at home and practical convenience in the area. Key features: - Approx. 117 m² living space. - 157 m² freehold plot. - Spacious living room with open kitchen. - First floor: 3 bedrooms and a large bathroom. - Second floor: 2 rooms, one laundry room and one sleeping/office room. - Energy label C. - Separate garage behind the garden, available for an additional €40,000 Interested? Arrange a viewing and discover the space, comfort and possibilities of this home on Rode Zee.
€ 450.000
Cost of copper (estimated): € 10.850
2% transfer tax (€ 9.000) + notary (€ 1.150) + valuation (€ 700)
Total purchase (incl. p.p.): € 460.850
3,02%
Yearly
€ 22.500
Direct available
Estimated mortgage
Indicative gross monthly cost
Based on annuity and 30 year term
Indicative net monthly cost
iDisclaimer: this mortgage calculation is a simplified indication based on general assumptions. No rights can be derived from the results shown. Calculated with 10-annual interest (met NHG), automatically determined based on the price limit € 470.000. Source: 10-jaars rente uit mortgage_rates (08-06-2026 03:45).
Douche, toilet, wastafel, en wastafelmeubel
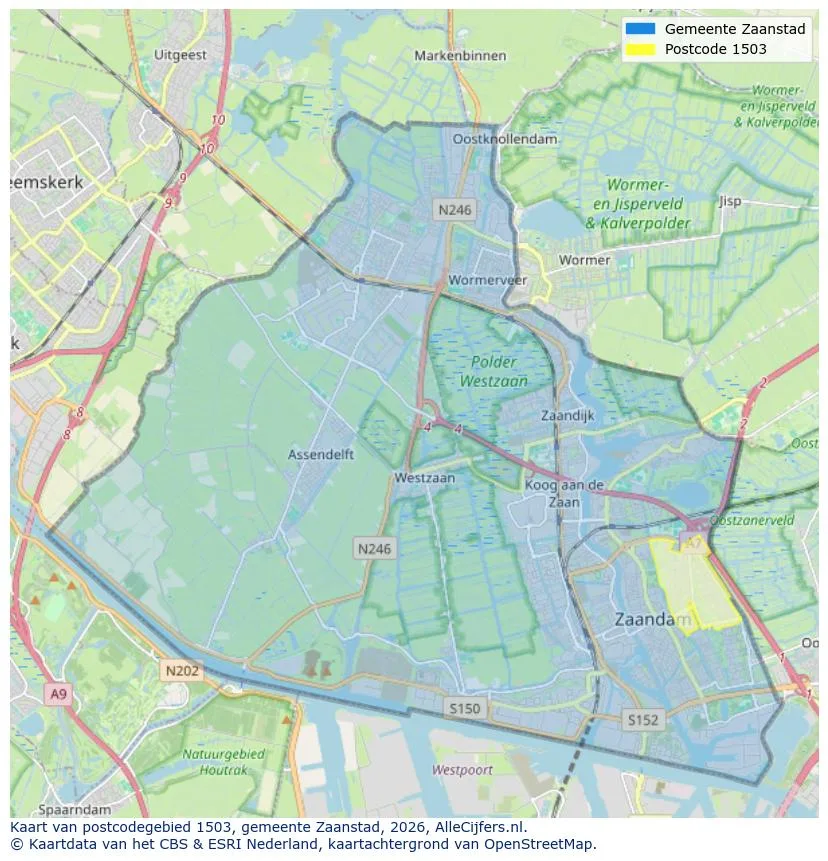
Geographic orientation and real estate agent density in Zaandam
View current location data on residents, WOZ development, housing stock, energy consumption, business activity and safety in Zaandam. In 2025 were there 82.410 residents. The average WOZ value in 2025 is EUR 370.266.
Residents
82.410
Last year: 2025
Average WOZ
EUR 370.266
Last year: 2025
Average income per person.
EUR 31.749
Source: AllNumbers
Crimes (current year)
4.747
Total registered
| Year | Residents |
|---|---|
| 2021 | 78.730 |
| 2022 | 79.070 |
| 2023 | 80.705 |
| 2024 | 81.465 |
| 2025 | 82.410 |
| Year | Average WOZ |
|---|---|
| 2021 | EUR 264.324 |
| 2022 | EUR 294.509 |
| 2023 | EUR 346.731 |
| 2024 | EUR 369.553 |
| 2025 | EUR 370.266 |
Hoger
16.920
Praktisch
18.340
Middelbaar
26.570
Europa
11.220
Nederland
40.460
Buiten Europa
30.725
Label C
10.587
Label A
8.954
Label B
4.739
Label D
3.411
Label G
2.958
Label E
2.698
Label F
1.816
Label A+++
1.337
Label A+
1.178
Label A++
847
Label A++++
64
Label A+++++
11
| Year | Gas (m3) | Electricity (kWh) |
|---|---|---|
| 2020 | 1.058 | 2.453 |
| 2021 | 1.158 | 2.467 |
| 2022 | 888 | 2.322 |
| 2023 | 778 | 2.191 |
| 2024 | 757 | 2.219 |
Hoekwoning
Gas: 1.035 • Electricity: 2.581
Huurwoning
Gas: 690 • Electricity: 1.855
Koopwoning
Gas: 875 • Electricity: 2.543
Appartement
Gas: 606 • Electricity: 1.781
Tussenwoning
Gas: 856 • Electricity: 2.449
Vrijstaande woning
Gas: 1.466 • Electricity: 3.420
Twee-onder-één-kap woning
Gas: 899 • Electricity: 2.305
Total number of company establishments: 12.465
| Period | Crimes |
|---|---|
| jan 2025 | 369 |
| jan 2026 | 361 |
| jul 2025 | 409 |
| jun 2025 | 366 |
| mei 2025 | 424 |
| mrt 2025 | 406 |
| nov 2024 | 403 |
| nov 2025 | 367 |
| okt 2024 | 374 |
| okt 2025 | 457 |
| sep 2024 | 354 |
| sep 2025 | 420 |
These figures give an indicative picture of safety trends in the living environment of Zaandam.
Short answers based on current local statistics, handy for a quick comparison of the living environment.
Zaandam telt in 2025 ongeveer 82.410 inwoners.
De gemiddelde WOZ-waarde in Zaandam is in 2025 circa € 370.266.
Het gemiddelde inkomen per inwoner in Zaandam ligt rond € 31.749 per jaar.
Voor het huidige jaar gaat het om ongeveer 4.747 geregistreerde misdrijven. Gebruik deze cijfers als indicatie en vergelijk trends per periode.
In Zaandam komt vooral "Appartementen" veel voor, met ongeveer 21.916 woningen.
View more homes in this location.

1506MG Zaandam
€ 2.900 p/m
€ 36/m²

1507TE Zaandam
€ 540.000 k.k.
€ 5.192/m²

1504CH Zaandam
€ 390.000 k.k.
€ 4.333/m²

1503EA Zaandam
€ 345.000 k.k.
€ 4.107/m²

1503EB Zaandam
€ 325.000 k.k.
€ 3.916/m²

1508WJ Zaandam
€ 320.000 k.k.
€ 4.923/m²

1507VD Zaandam
€ 795.000 k.k.
€ 5.372/m²
1504JM Zaandam
€ 2.250 p/m
€ 19/m²
