
Residents
171.822
Last year: 2026
6846NC Arnhem • Gelderland
€ 750.000
Cost of copper (estimated): € 16.850
2% transfer tax (€ 15.000) + notary (€ 1.150) + valuation (€ 700)
Total incl. VAT: € 766.850
Purchase price /m²: € 4.545
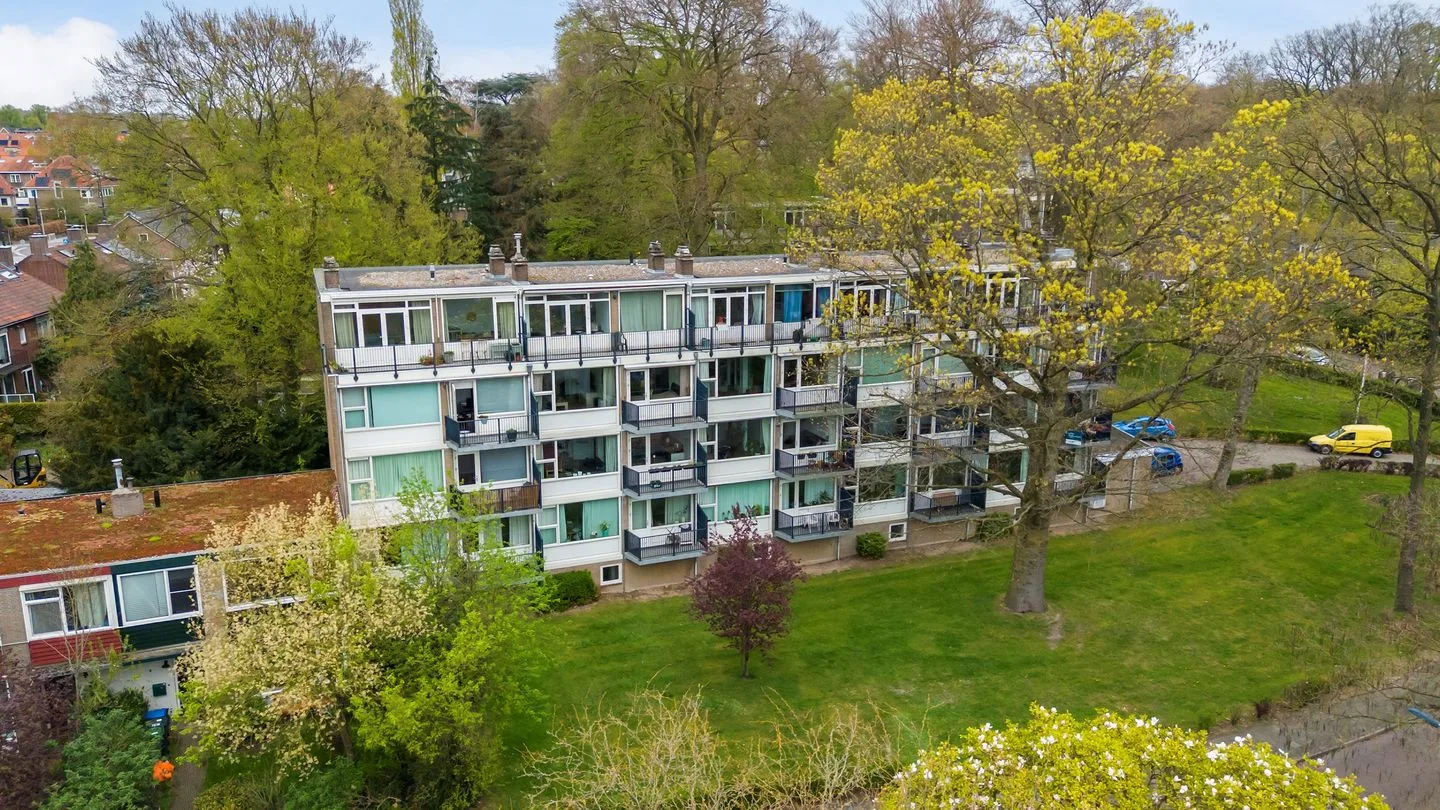
De 18 tweekappers van dit type liggen verspreid over fase 1 van het Dillekwartier. Er zijn verschillende architectuurvarianten; met een muurkapel of zonder, met aangebouwde stenen berging of een vrijstaande stenen berging in de royale tuin. De woningen zijn extra breed en hebben standaard een aanbouw van 2.40 meter voor extra leefruimte en woonplezier. De zijentree zorgt voor een speelse indeling van de begane grond. Via de hal met trapopgang en toilet kom je in een grote open ruimte die verdeeld is in een ruime woonkamer en een royale leefkeuken met ruimte voor een kookeiland en een lekker grote eettafel. De woningen zijn aan elkaar gespiegeld en aan de voorzijde is een stenen berging aangebouwd die ook via de tuin toegankelijk is. Op de verdieping is een ruime overloop waaraan drie slaapkamers grenzen, net als de badkamer met douche, bad, dubbele wastafel en een toilet. Een vaste trap naar zolder brengt je naar een grote en zeer hoge ruimte die je kunt indelen zoals jij dat wilt. Hier is ruimte voor extra slaapkamers of een fijne hobbyruimte.
€ 750.000
Cost of copper (estimated): € 16.850
2% transfer tax (€ 15.000) + notary (€ 1.150) + valuation (€ 700)
Total purchase (incl. p.p.): € 766.850
3,04%
Yearly
€ 37.500
Direct available
Estimated mortgage
Indicative gross monthly cost
Based on annuity and 30 year term
Indicative net monthly cost
iDisclaimer: this mortgage calculation is a simplified indication based on general assumptions. No rights can be derived from the results shown. Calculated with 10-annual interest (zonder NHG), automatically determined based on the price limit € 470.000. Source: 10-jaars rente uit mortgage_rates (05-05-2026 03:45). For non-NHG, an 80% mortgage of the market value has been used in this indication.
Douche, dubbele wastafel, ligbad, en toilet
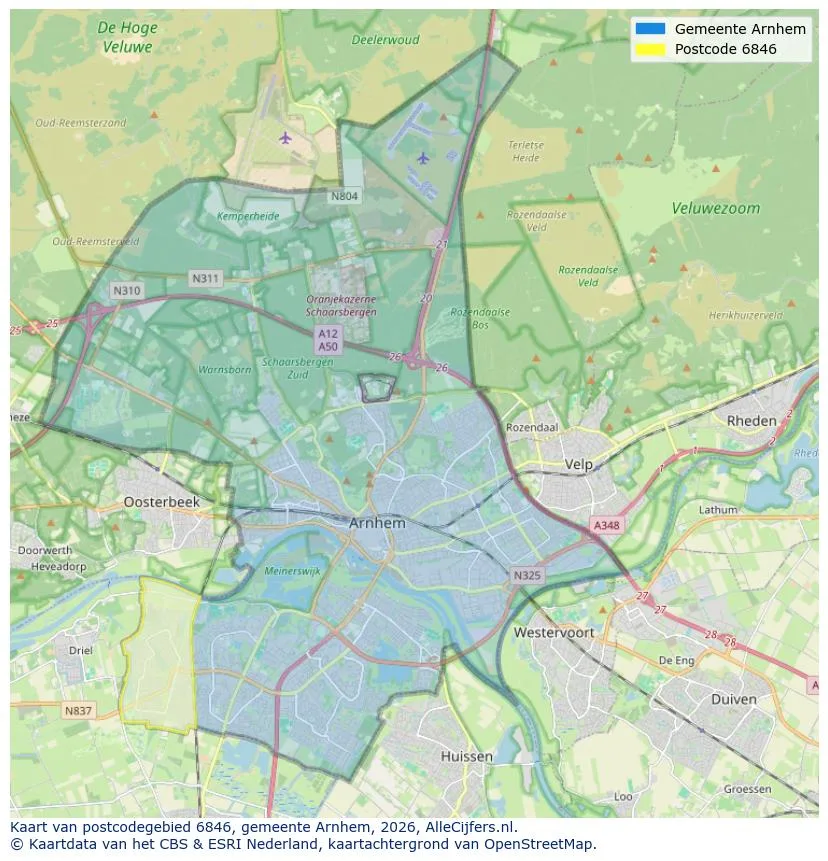
View the location and discover the brokers in this region
View current location data on residents, WOZ development, housing stock, energy consumption, business activity and safety in Arnhem. In 2026 were there 171.822 residents. The average WOZ value in 2025 is EUR 350.000.
Residents
171.822
Last year: 2026
Average WOZ
EUR 350.000
Last year: 2025
Average income per person.
EUR 33.300
Source: AllNumbers
Crimes (current year)
11.361
Total registered
| Year | Residents |
|---|---|
| 2022 | 163.888 |
| 2023 | 165.770 |
| 2024 | 167.632 |
| 2025 | 169.364 |
| 2026 | 171.822 |
| Year | Average WOZ |
|---|---|
| 2021 | EUR 240.000 |
| 2022 | EUR 265.000 |
| 2023 | EUR 322.000 |
| 2024 | EUR 335.000 |
| 2025 | EUR 350.000 |
Hoger
38
Praktisch
26
Middelbaar
37
Europa
15.436
Nederland
105.513
Buiten Europa
48.415
Label A
21.789
Label C
20.317
Label B
11.072
Label D
6.974
Label E
6.628
Label G
6.375
Label F
4.142
Label A+
3.314
Label A++
2.112
Label A+++
1.128
Label A++++
154
Label A+++++
9
| Year | Gas (m3) | Electricity (kWh) |
|---|---|---|
| 2020 | 960 | 2.470 |
| 2021 | 1.080 | 2.510 |
| 2022 | 850 | 2.370 |
| 2023 | 720 | 2.230 |
| 2024 | 710 | 2.280 |
Hoekwoning
Gas: 890 • Electricity: 2.620
Huurwoning
Gas: 640 • Electricity: 1.910
Koopwoning
Gas: 830 • Electricity: 2.660
Appartement
Gas: 600 • Electricity: 1.800
Tussenwoning
Gas: 750 • Electricity: 2.440
Vrijstaande woning
Gas: 1.330 • Electricity: 4.210
Twee-onder-één-kap woning
Gas: 1.000 • Electricity: 3.180
Total number of company establishments: 25.615
| Period | Crimes |
|---|---|
| jan 2026 | 894 |
| jul 2025 | 914 |
| jun 2025 | 1.024 |
| mei 2025 | 941 |
| mrt 2025 | 972 |
| mrt 2026 | 909 |
| nov 2024 | 962 |
| nov 2025 | 849 |
| okt 2024 | 1.081 |
| okt 2025 | 1.122 |
| sep 2024 | 1.021 |
| sep 2025 | 871 |
These figures give an indicative picture of safety trends in the living environment of Arnhem.
Short answers based on current local statistics, handy for a quick comparison of the living environment.
Arnhem telt in 2026 ongeveer 171.822 inwoners.
De gemiddelde WOZ-waarde in Arnhem is in 2025 circa € 350.000.
Het gemiddelde inkomen per inwoner in Arnhem ligt rond € 33.300 per jaar.
Voor het huidige jaar gaat het om ongeveer 11.361 geregistreerde misdrijven. Gebruik deze cijfers als indicatie en vergelijk trends per periode.
In Arnhem komt vooral "Appartementen" veel voor, met ongeveer 41.243 woningen.
View more homes in this location.

6824GJ Arnhem
€ 239.000 k.k.

6843WT Arnhem
€ 400.000 k.k.

6828WE Arnhem
€ 250.000 k.k.
€ 4.808/m²

6846DA Arnhem
€ 595.000 k.k.
€ 4.190/m²

6822EA Arnhem
€ 300.000 k.k.
€ 4.286/m²
6824ML Arnhem
€ 269.000 k.k.
€ 4.638/m²

6846SZ Arnhem
€ 425.000 k.k.
€ 5.519/m²
6845KB Arnhem
€ 375.000 k.k.
€ 4.310/m²
