
Residents
5.410
Last year: 2025
2121CC Bennebroek • Noord-Holland
€ 625.000 k.k.
Cost of copper (estimated): € 14.350
2% transfer tax (€ 12.500) + notary (€ 1.150) + valuation (€ 700)
Total incl. VAT: € 639.350
Purchase price /m²: € 4.735
Lage Duin 19 in Bennebroek biedt een fijne eengezinswoning met veel ruimte voor moderne renovatie, ideaal voor gezinnen. Het huis heeft een Z-vormige woonkamer met royale zithoek en schuifpui naar de zonnige achtertuin, een halfopen keuken en vijf slaapkamers verdeeld over twee verdiepingen. De woning ligt in een kindvriendelijke buurt nabij basisscholen, speeltuinen en sportvoorzieningen met toegang tot diverse recreatiegebieden zoals bos en duinen. Dagelijkse gemakken zijn binnen korte afstand bereik en er zijn verschillende basisscholen en uitvalswegen in de omgeving. Met een ruim perceel van 173m2 en een woonoppervlakte van 132m2 biedt deze woning veel mogelijkheden voor privé leefomgevingen met garage en zonnige tuin.
€ 625.000
Cost of copper (estimated): € 14.350
2% transfer tax (€ 12.500) + notary (€ 1.150) + valuation (€ 700)
Total purchase (incl. p.p.): € 639.350
3,04%
Yearly
€ 31.250
Direct available
Estimated mortgage
Indicative gross monthly cost
Based on annuity and 30 year term
Indicative net monthly cost
iDisclaimer: this mortgage calculation is a simplified indication based on general assumptions. No rights can be derived from the results shown. Calculated with 10-annual interest (zonder NHG), automatically determined based on the price limit € 470.000. Source: 10-jaars rente uit mortgage_rates (06-05-2026 03:45). For non-NHG, an 80% mortgage of the market value has been used in this indication.
Douche, ligbad, toilet, en wastafel
Elektra
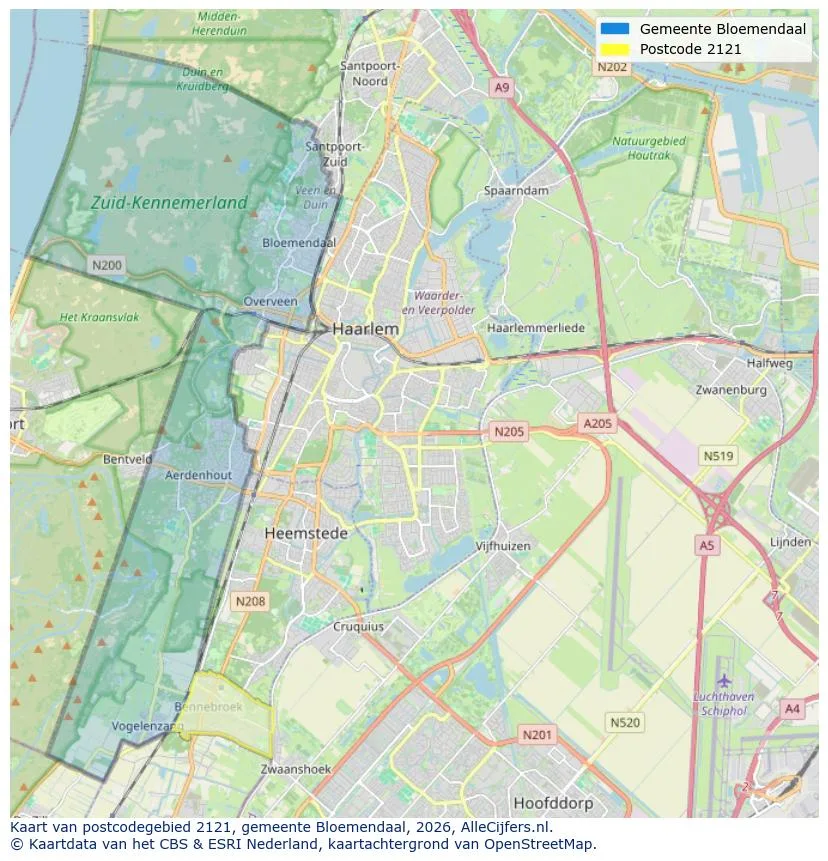
Explore Bennebroek and the surrounding areas
View current location data on residents, WOZ development, housing stock, energy consumption, business activity and safety in Bennebroek. In 2025 were there 5.410 residents. The average WOZ value in 2025 is EUR 580.000.
Residents
5.410
Last year: 2025
Average WOZ
EUR 580.000
Last year: 2025
Average income per person.
EUR 42.600
Source: AllNumbers
Crimes (current year)
113
Total registered
| Year | Residents |
|---|---|
| 2021 | 5.275 |
| 2022 | 5.255 |
| 2023 | 5.460 |
| 2024 | 5.410 |
| 2025 | 5.410 |
| Year | Average WOZ |
|---|---|
| 2021 | EUR 475.000 |
| 2022 | EUR 515.000 |
| 2023 | EUR 574.000 |
| 2024 | EUR 560.000 |
| 2025 | EUR 580.000 |
Hoger
1.800
Praktisch
770
Middelbaar
1.120
Europa
515
Nederland
4.195
Buiten Europa
705
Label C
573
Label A
383
Label D
320
Label F
289
Label B
265
Label E
257
Label G
188
Label A+
45
Label A++
16
Label A+++
5
Label A++++
0
Label A+++++
0
| Year | Gas (m3) | Electricity (kWh) |
|---|---|---|
| 2020 | 1.480 | 3.010 |
| 2021 | 1.680 | 3.040 |
| 2022 | 1.300 | 2.810 |
| 2023 | 1.120 | 2.640 |
| 2024 | 1.070 | 2.690 |
Hoekwoning
Gas: 1.180 • Electricity: 2.770
Huurwoning
Gas: 770 • Electricity: 1.760
Koopwoning
Gas: 1.280 • Electricity: 3.040
Appartement
Gas: 780 • Electricity: 1.740
Tussenwoning
Gas: 990 • Electricity: 2.410
Vrijstaande woning
Gas: 1.900 • Electricity: 4.370
Twee-onder-één-kap woning
Gas: 1.460 • Electricity: 3.560
Total number of company establishments: 745
| Period | Crimes |
|---|---|
| jan 2025 | 7 |
| jan 2026 | 5 |
| jul 2025 | 8 |
| jun 2025 | 13 |
| mei 2025 | 15 |
| mrt 2025 | 8 |
| nov 2024 | 7 |
| nov 2025 | 9 |
| okt 2024 | 16 |
| okt 2025 | 11 |
| sep 2024 | 19 |
| sep 2025 | 12 |
These figures give an indicative picture of safety trends in the living environment of Bennebroek.
Short answers based on current local statistics, handy for a quick comparison of the living environment.
Bennebroek telt in 2025 ongeveer 5.410 inwoners.
De gemiddelde WOZ-waarde in Bennebroek is in 2025 circa € 580.000.
Het gemiddelde inkomen per inwoner in Bennebroek ligt rond € 42.600 per jaar.
Voor het huidige jaar gaat het om ongeveer 113 geregistreerde misdrijven. Gebruik deze cijfers als indicatie en vergelijk trends per periode.
In Bennebroek komt vooral "Tussenwoningen" veel voor, met ongeveer 811 woningen.
View more homes in this location.

2121XZ Bennebroek
€ 895.000 k.k.

2121VX Bennebroek
€ 1.195.000 k.k.
€ 5.887/m²

2121BB Bennebroek
€ 689.000 k.k.
€ 6.152/m²

2121GR Bennebroek
€ 600.000 k.k.
€ 4.918/m²

2121TB Bennebroek
€ 549.000 k.k.
€ 4.427/m²

2121VG Bennebroek
€ 800.000 k.k.
€ 5.926/m²

2121GX Bennebroek
€ 739.000 k.k.
€ 5.132/m²

2121VH Bennebroek
€ 1.069.000 k.k.
€ 5.747/m²
