- Available
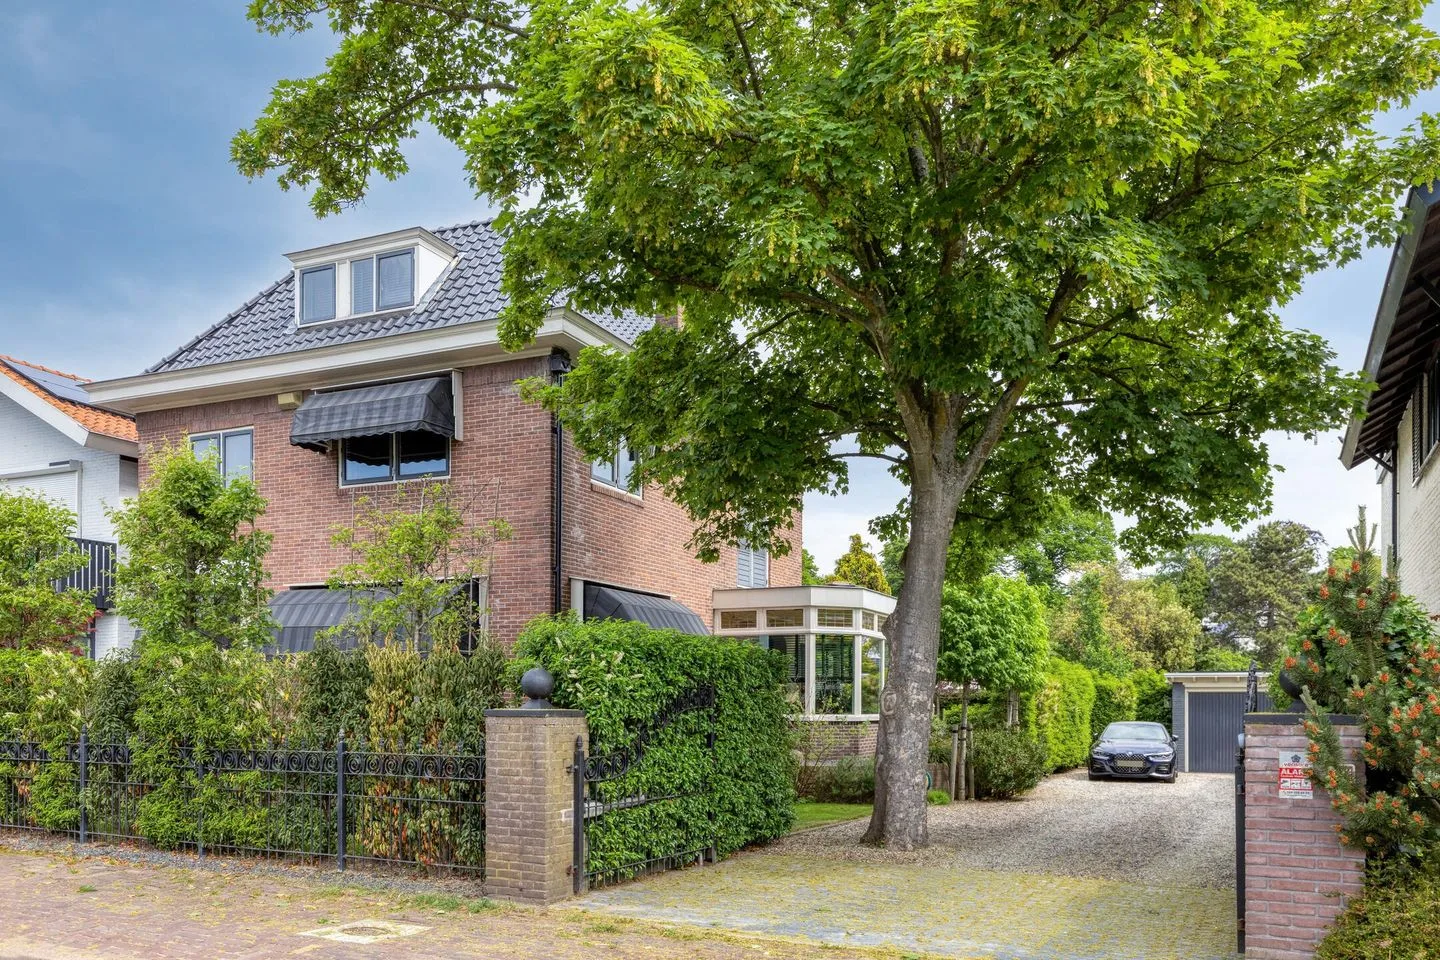
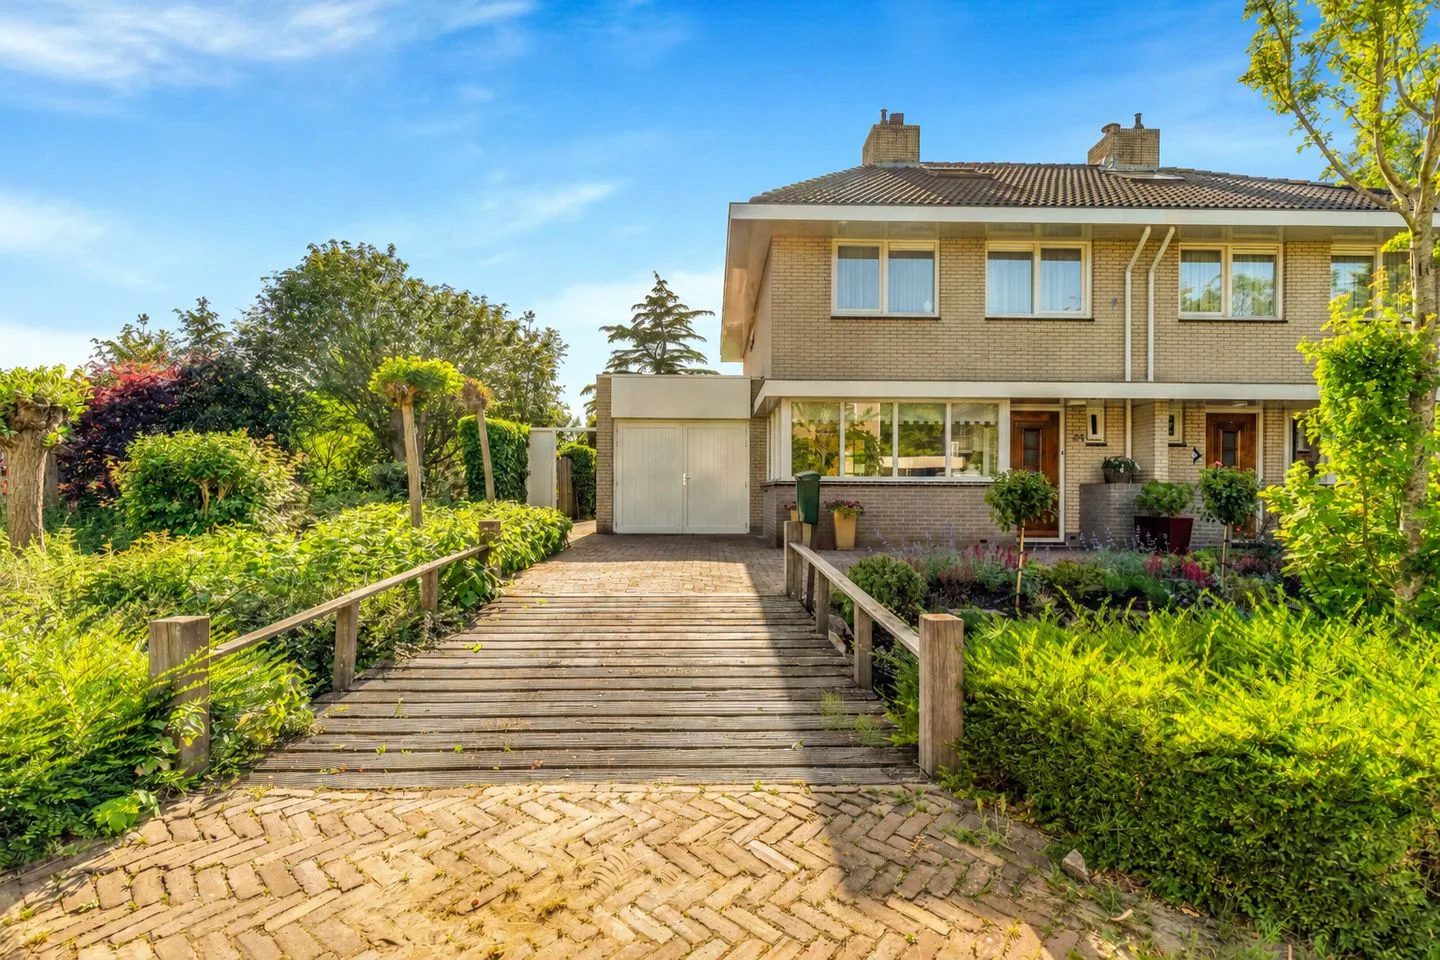
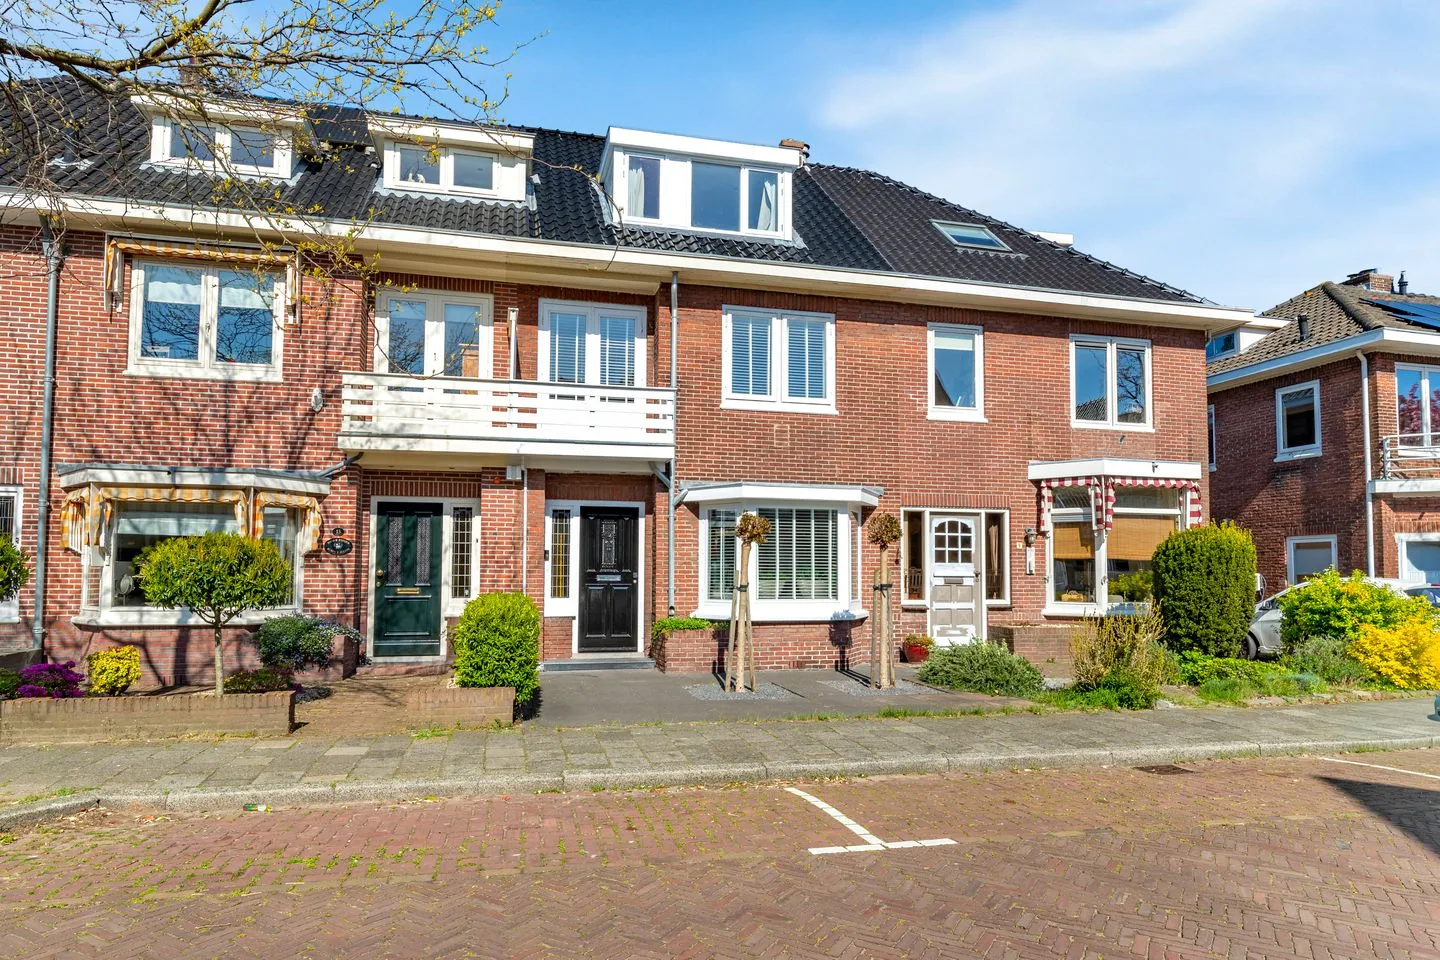
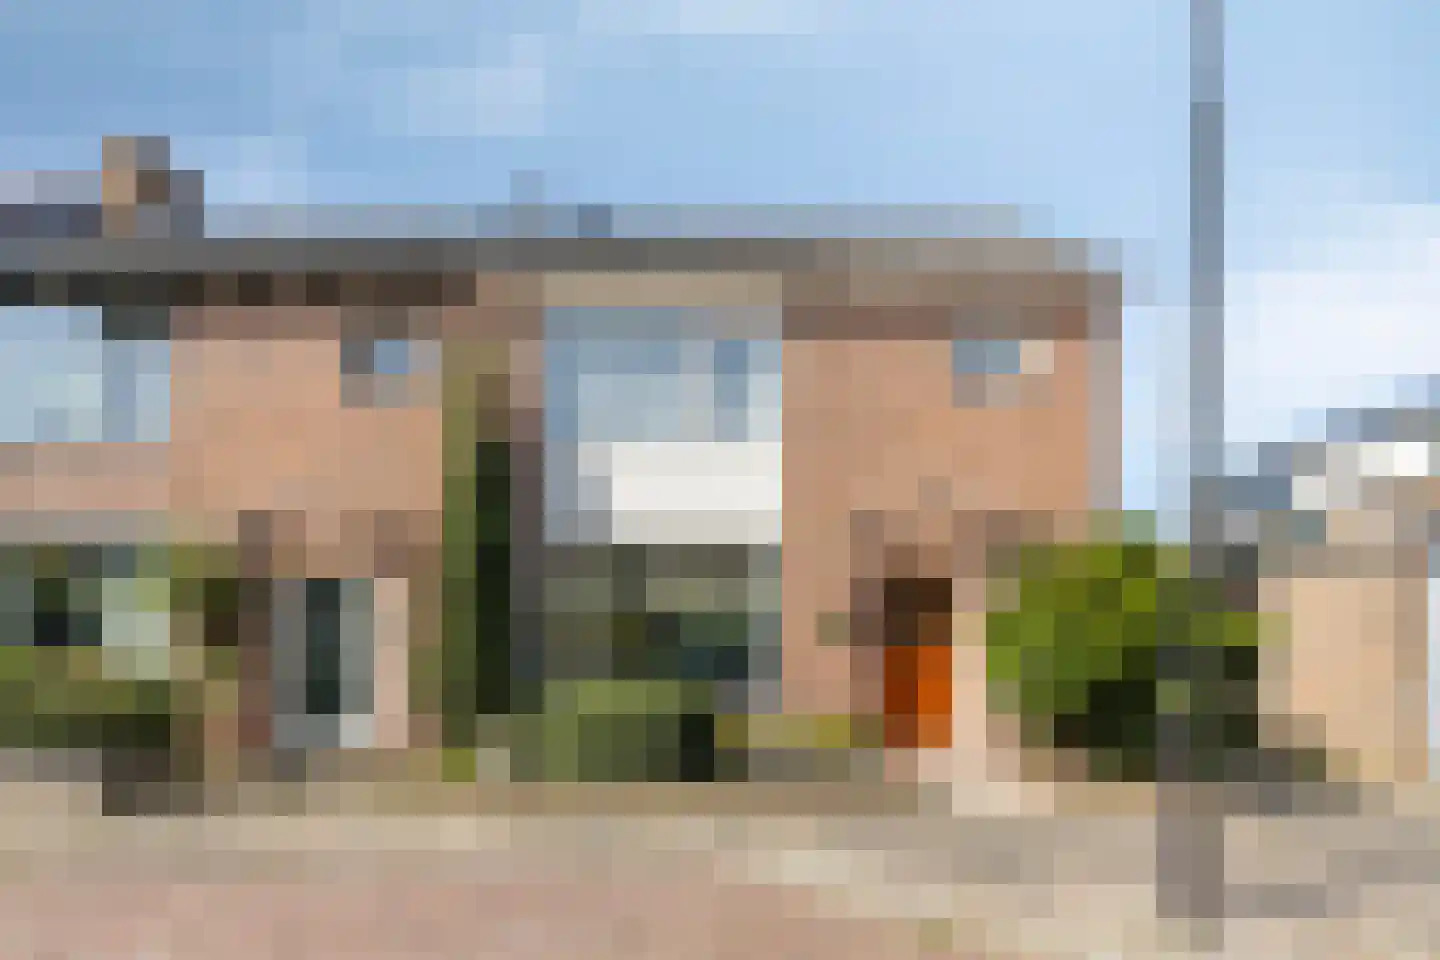
Vondellaan 34
1942LJ Beverwijk
€ 1.800.000 k.k.
€ 4.401/m²
D
Save as favorite
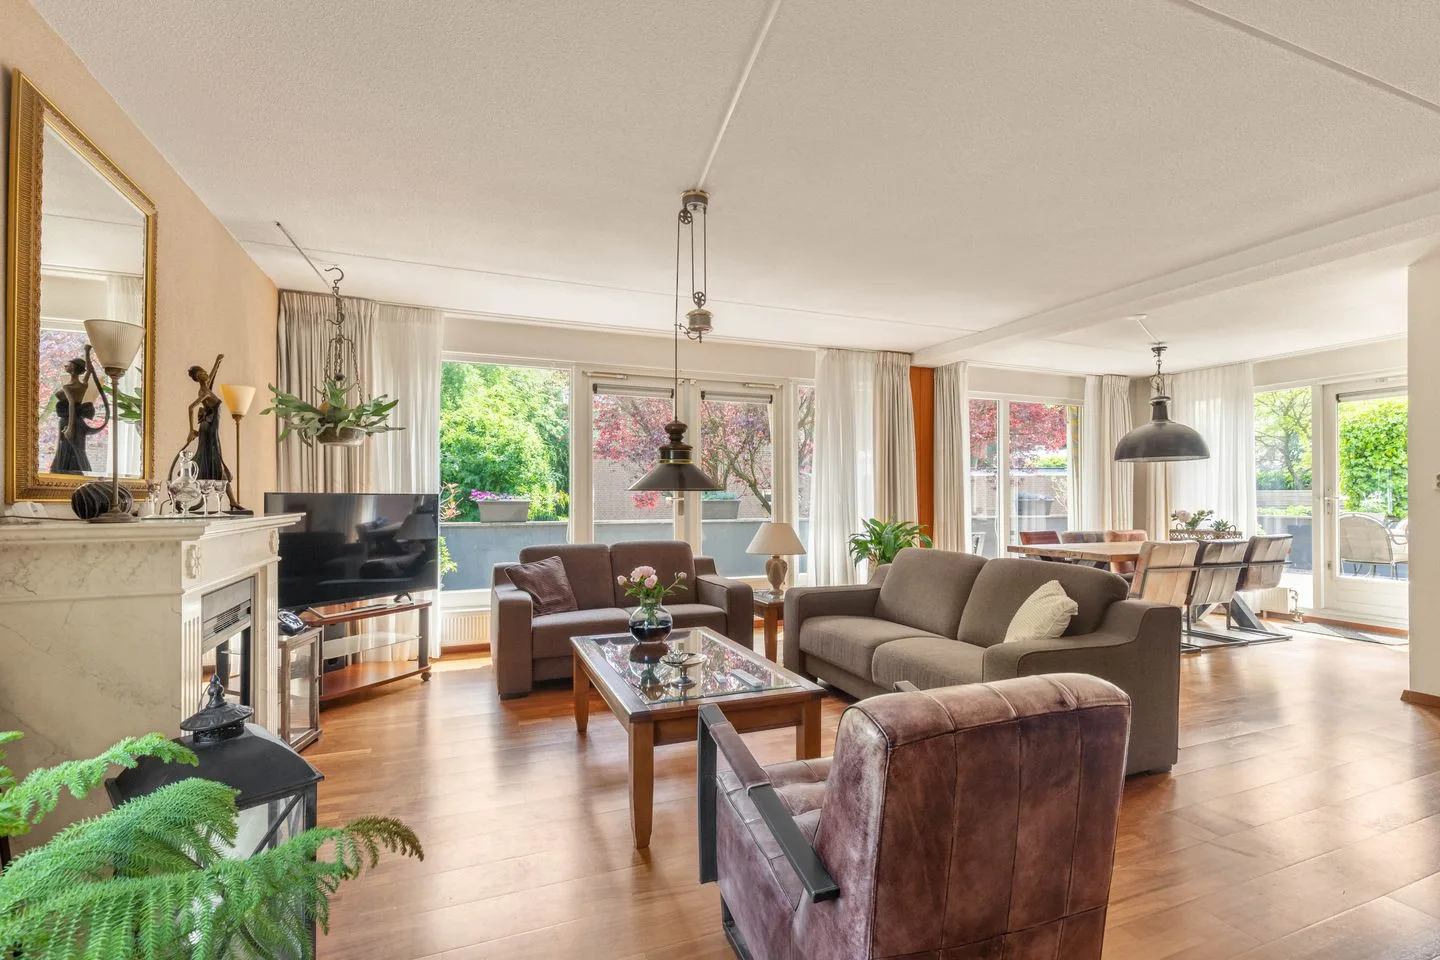
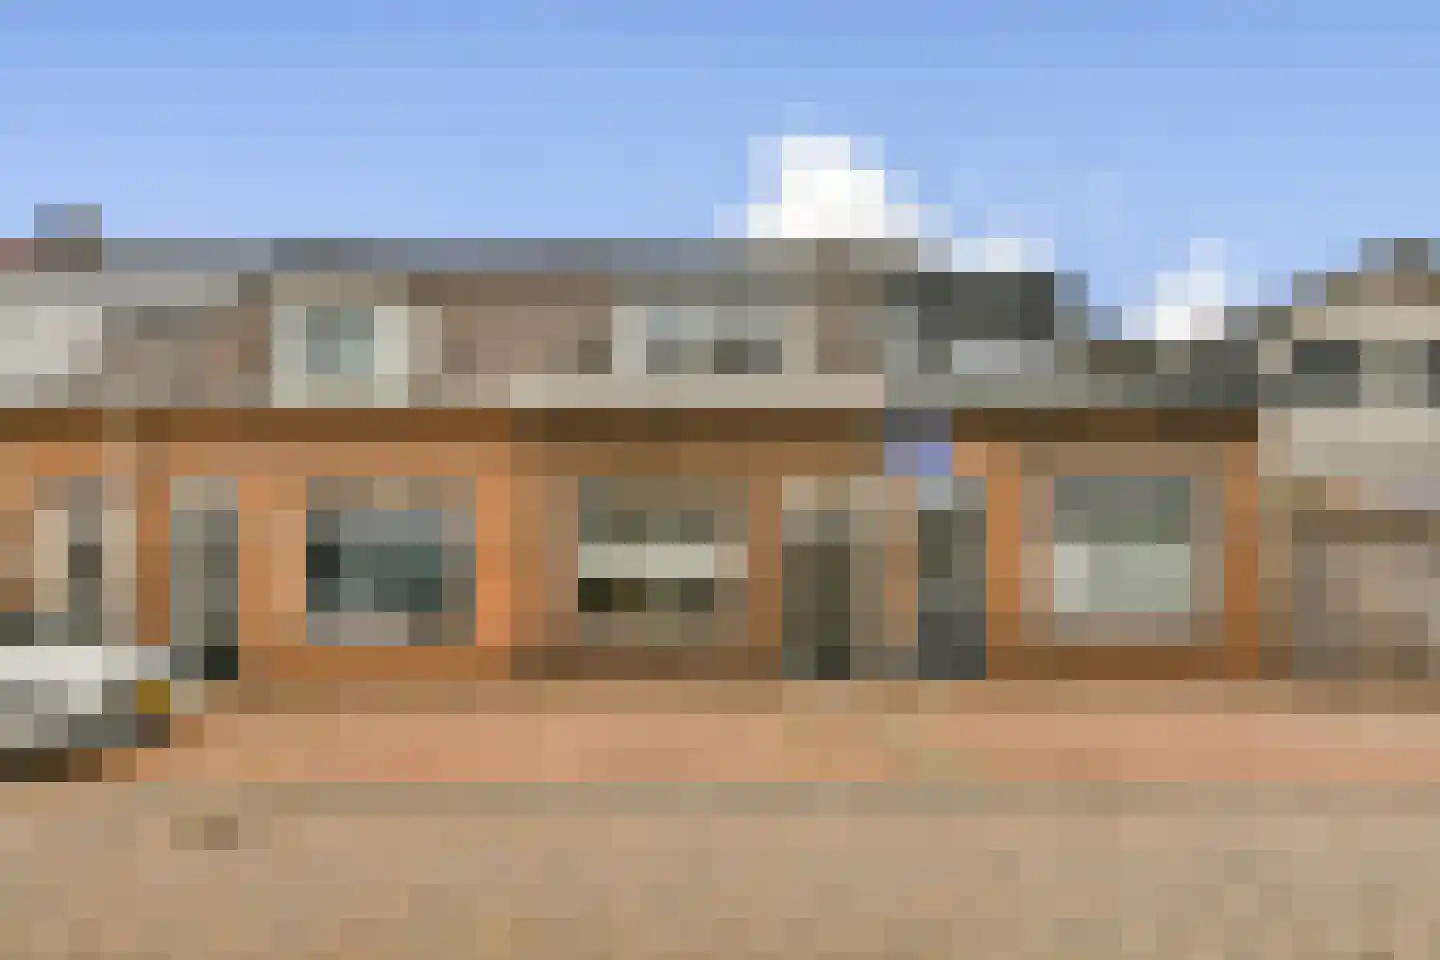
- Living area
- 409 m²
- Land area
- 1469 m²
- Bedrooms
- 6