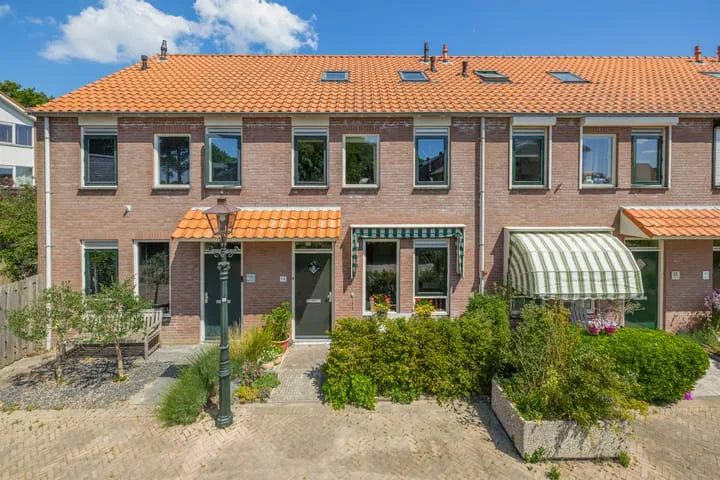
Houses sold in Brielle

View 168 sold houses in Brielle

Connected to: Vastgoed Nederland NVM Makelaars

On this page you will find recently sold homes in Brielle. Use this overview to better estimate selling prices, popular neighborhoods, and the local housing supply before you choose a real estate agent. Also view the current housing supply with 238 houses in Brielle.

Selection

Search and filter homes

Set your preferences and discover homes that suit you.

Total supply 243.189
Filters

Set price, area and other characteristics. Adjust a filter or click on Show homes. Location changes directly above.

Reset filters

You search for

  • Place Brielle
  • Status Sold

Huis verkopen in Brielle? Vergelijk verkoopmakelaars

Bekijk recente verkopen en ontvang gratis offertes van lokale makelaars. Vergelijk meer dan 42 makelaars in Brielle.

Free request a quote

  • Quotes in Brielle
  • Non-binding
  • Personal
  • Compare free rates

Recent verkocht in Brielle? Lees de verkoopgerichte gids huis verkopen in Brielle, vergelijk verkoopmakelaars in Brielle of bekijk de beste verkoopmakelaars in Brielle voor referentie bij jouw keuze.

Vergelijk meerdere offertes

Makelaars maken scherpere voorstellen als ze weten dat je vergelijkt — vraag offertes aan voor verkoop of aankoop.

Frequently asked questions about sold homes in Brielle

Short answers about housing prices, sold homes and comparing real estate agents in Brielle.

Residential and neighborhood statistics in Brielle

View current location data on residents, WOZ development, housing stock, energy consumption, business activity and safety in Brielle. In 2025 were there 14.235 residents. The average WOZ value in 2025 is EUR 378.270.

These figures help to better assess and compare the housing stock in Brielle with recent sold homes. Orient yourself then on suitable top real estate agents in Brielle for sales advice in this region.

Residents

14.235

Last year: 2025

Average WOZ

EUR 378.270

Last year: 2025

Average income per person.

EUR 39.546

Source: AllNumbers

Crimes (current year)

387

Total registered

Demographics and WOZ development

Inhabitants per year

Inhabitants per year in Brielle
Year Residents
2021 13.710
2022 13.920
2023 14.140
2024 14.155
2025 14.235

Annual WOZ value

WOZ value per year in Brielle
Year Average WOZ
2021 EUR 270.461
2022 EUR 297.417
2023 EUR 345.330
2024 EUR 373.278
2025 EUR 378.270

Composition of residents

Age build-up

65+: 3.465 0-15: 2.045 15-25: 1.355 25-45: 3.400 45-65: 3.960

Education level

Hoger

2.840

Praktisch

2.730

Middelbaar

4.790

Origin of residents (2025)

Europa

1.295

Nederland

11.445

Buiten Europa

1.480

Housing stock and construction periods

Types of homes

Hoekwoningen 1.245
Appartementen 1.718
Tussenwoningen 3.200
Vrijstaande woningen 437
Twee-onder-één-kap woningen 294

Construction period of buildings

Voor 1700 81
1700 tot 1900 507
1900 tot 1925 143
1925 tot 1950 198
1950 tot 1970 1.450
1970 tot 1980 1.321
1980 tot 1990 438
1990 tot 2000 784
2000 tot 2010 379
2010 tot 2020 391
2020 en later 180

Energy and sustainability

Energy label distribution

Label C

2.020

Label A

1.536

Label B

1.032

Label D

532

Label F

468

Label E

397

Label G

344

Label A++

218

Label A+

171

Label A+++

41

Label A++++

8

Label A+++++

0

Average energy consumption per year

Average energy consumption per year in Brielle
Year Gas (m3) Electricity (kWh)
2020 1.091 2.902
2021 1.202 2.962
2022 912 2.772
2023 801 2.592
2024 791 2.612

Consumption per house type

Hoekwoning

Gas: 968 • Electricity: 2.725

Huurwoning

Gas: 709 • Electricity: 2.226

Koopwoning

Gas: 861 • Electricity: 2.821

Appartement

Gas: 499 • Electricity: 2.126

Tussenwoning

Gas: 828 • Electricity: 2.545

Vrijstaande woning

Gas: 1.158 • Electricity: 4.292

Twee-onder-één-kap woning

Gas: 1.040 • Electricity: 2.961

Business activity in Brielle (2025)

Handel en HORECA 295
Nijverheid en energie 250
Zakelijke dienstverlening 435
Overheid, onderwijs en zorg 285
Landbouw, bosbouw en visserij 30
Vervoer, informatie en communicatie 85
Financiele diensten en onroerendgoed 95
Cultuur, recreatie en overige diensten 195

Total number of company establishments: 1.685

Recent crime statistics

Recent crime statistics in Brielle
Period Crimes
jan 2025 37
jan 2026 41
jul 2025 25
jun 2025 35
mei 2025 36
mrt 2025 33
nov 2024 35
nov 2025 41
okt 2024 51
okt 2025 38
sep 2024 49
sep 2025 25

These figures give an indicative picture of safety trends in the living environment of Brielle.

Frequently asked questions about living in Brielle

Short answers based on current local statistics, handy for a quick comparison of the living environment.

Hoeveel inwoners heeft Brielle?

Brielle telt in 2025 ongeveer 14.235 inwoners.

Wat is de gemiddelde WOZ-waarde in Brielle?

De gemiddelde WOZ-waarde in Brielle is in 2025 circa € 378.270.

Wat is het gemiddelde inkomen per inwoner in Brielle?

Het gemiddelde inkomen per inwoner in Brielle ligt rond € 39.546 per jaar.

Hoe veilig is wonen in Brielle?

Voor het huidige jaar gaat het om ongeveer 387 geregistreerde misdrijven. Gebruik deze cijfers als indicatie en vergelijk trends per periode.

Welke woningtypen komen het meest voor in Brielle?

In Brielle komt vooral "Tussenwoningen" veel voor, met ongeveer 3.200 woningen.

Receive free, non-binding quotes

Compare multiple real estate agents and choose the best match.