
Residents
69.644
Last year: 2026
2905AE Capelle aan den IJssel • Zuid-Holland
For this property, no detailed description is available yet.
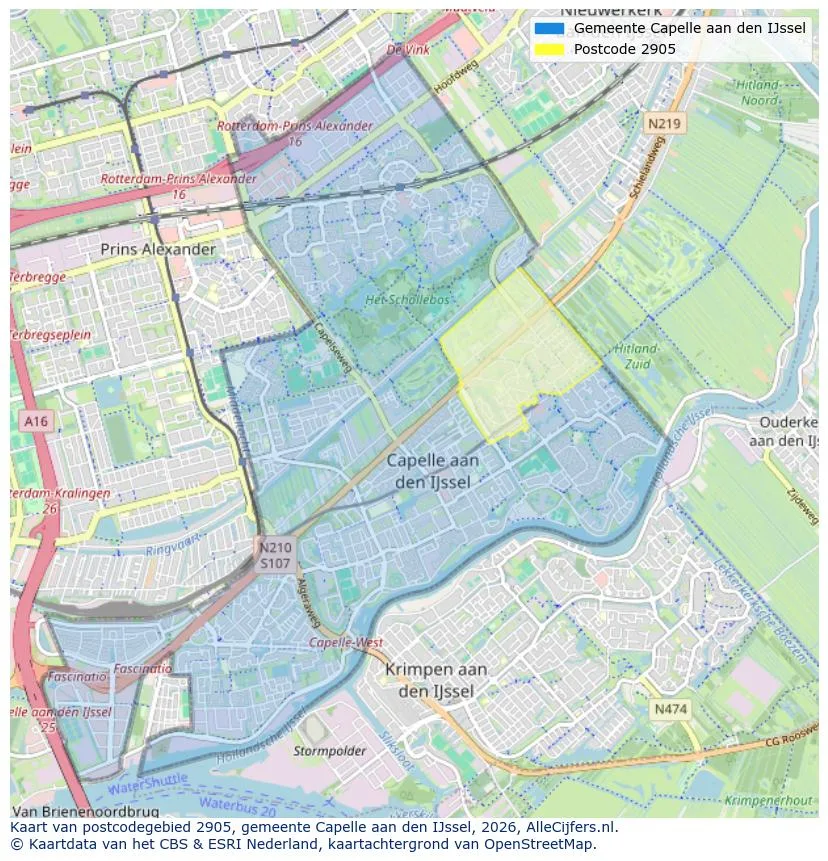
View the location and discover the brokers in this region
View current location data on residents, WOZ development, housing stock, energy consumption, business activity and safety in Capelle aan den IJssel. In 2026 were there 69.644 residents. The average WOZ value in 2025 is EUR 362.000.
Residents
69.644
Last year: 2026
Average WOZ
EUR 362.000
Last year: 2025
Average income per person.
EUR 34.500
Source: AllNumbers
Crimes (current year)
2.948
Total registered
| Year | Residents |
|---|---|
| 2022 | 67.188 |
| 2023 | 67.552 |
| 2024 | 67.925 |
| 2025 | 68.624 |
| 2026 | 69.644 |
| Year | Average WOZ |
|---|---|
| 2021 | EUR 246.000 |
| 2022 | EUR 270.000 |
| 2023 | EUR 310.000 |
| 2024 | EUR 350.000 |
| 2025 | EUR 362.000 |
Hoger
31
Praktisch
27
Middelbaar
42
Europa
6.178
Nederland
39.311
Buiten Europa
23.135
Label C
9.606
Label A
9.392
Label B
6.657
Label D
2.542
Label E
2.008
Label F
785
Label G
741
Label A+
739
Label A+++
654
Label A++
309
Label A++++
256
Label A+++++
5
| Year | Gas (m3) | Electricity (kWh) |
|---|---|---|
| 2020 | 730 | 2.700 |
| 2021 | 800 | 2.750 |
| 2022 | 620 | 2.590 |
| 2023 | 550 | 2.400 |
| 2024 | 540 | 2.400 |
Hoekwoning
Gas: 720 • Electricity: 2.900
Huurwoning
Gas: 480 • Electricity: 2.030
Koopwoning
Gas: 610 • Electricity: 2.710
Appartement
Gas: 460 • Electricity: 1.980
Tussenwoning
Gas: 570 • Electricity: 2.770
Vrijstaande woning
Gas: 1.430 • Electricity: 4.560
Twee-onder-één-kap woning
Gas: 1.000 • Electricity: 3.580
Total number of company establishments: 9.115
| Period | Crimes |
|---|---|
| jan 2025 | 250 |
| jan 2026 | 289 |
| jul 2025 | 271 |
| jun 2025 | 249 |
| mei 2025 | 232 |
| mrt 2025 | 245 |
| nov 2024 | 223 |
| nov 2025 | 219 |
| okt 2024 | 230 |
| okt 2025 | 246 |
| sep 2024 | 207 |
| sep 2025 | 225 |
These figures give an indicative picture of safety trends in the living environment of Capelle aan den IJssel.
Short answers based on current local statistics, handy for a quick comparison of the living environment.
Capelle aan den IJssel telt in 2026 ongeveer 69.644 inwoners.
De gemiddelde WOZ-waarde in Capelle aan den IJssel is in 2025 circa € 362.000.
Het gemiddelde inkomen per inwoner in Capelle aan den IJssel ligt rond € 34.500 per jaar.
Voor het huidige jaar gaat het om ongeveer 2.948 geregistreerde misdrijven. Gebruik deze cijfers als indicatie en vergelijk trends per periode.
In Capelle aan den IJssel komt vooral "Appartementen" veel voor, met ongeveer 18.797 woningen.
View more homes in this location.

2907SE Capelle aan den IJssel
€ 309.000 k.k.
€ 4.544/m²

2905ND Capelle aan den IJssel
€ 355.000 k.k.
€ 3.817/m²

2905NB Capelle aan den IJssel
€ 355.000 k.k.
€ 3.817/m²

2905AR Capelle aan den IJssel
€ 500.000 k.k.
€ 3.650/m²

2902VG Capelle aan den IJssel
€ 1.925 p/m
€ 23/m²

2908MG Capelle aan den IJssel
€ 1.150 p/m
€ 17/m²

2902CC Capelle aan den IJssel
€ 225.000 k.k.
€ 6.250/m²
2903LS Capelle aan den IJssel
€ 349.000 k.k.
€ 4.256/m²
