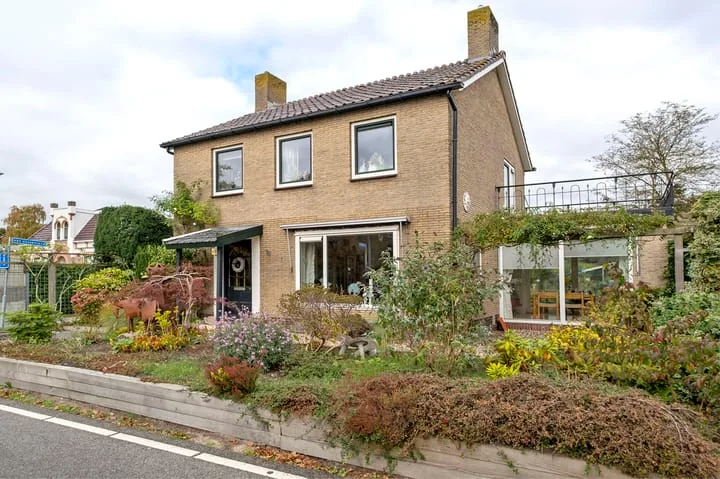
Houses sold in Dieverbrug

View 1 sold residence in Dieverbrug

Connected to: Vastgoed Nederland NVM Makelaars

On this page you will find recently sold homes in Dieverbrug. Use this overview to better estimate selling prices, popular neighborhoods, and the local housing supply before you choose a real estate agent. Also view the current housing supply with 1 residence in Dieverbrug.

Selection

Search and filter homes

Set your preferences and discover homes that suit you.

Total supply 242.852
Filters

Set price, area and other characteristics. Adjust a filter or click on Show homes. Location changes directly above.

Reset filters

You search for

  • Place Dieverbrug
  • Status Sold

Sell your house in Dieverbrug? Compare real estate agents

View recent sales and receive free quotes from local real estate agents. Compare more than 16 real estate agents in Dieverbrug.

Free request a quote

  • Quotes in Dieverbrug
  • Non-binding
  • Personal
  • Compare free rates

Selling your own home in Dieverbrug? Compare real estate agents in Dieverbrug or view the best real estate agents in Dieverbrug as a reference for your choice.

Compare multiple quotes

Real estate agents make sharper offers when they know you're comparing — ask for quotes for sale or purchase.

Frequently asked questions about sold homes in Dieverbrug

Short answers about housing prices, sold homes and comparing real estate agents in Dieverbrug.

Residential and neighborhood statistics in Dieverbrug

View current location data on residents, WOZ development, housing stock, energy consumption, business activity and safety in Dieverbrug. In 2026 were there 164 residents. The average WOZ value in 2025 is EUR 491.435.

These figures help to better assess and compare the housing stock in Dieverbrug with recent sold homes. Orient yourself then on suitable top real estate agents in Dieverbrug for sales advice in this region.

Residents

164

Last year: 2026

Average WOZ

EUR 491.435

Last year: 2025

Average income per person.

EUR 36.249

Source: AllNumbers

Crimes (current year)

13

Total registered

Demographics and WOZ development

Inhabitants per year

Inhabitants per year in Dieverbrug
Year Residents
2021 170
2022 172
2023 166
2024 166
2025 163
2026 164

Annual WOZ value

WOZ value per year in Dieverbrug
Year Average WOZ
2021 EUR 369.288
2022 EUR 389.030
2023 EUR 439.059
2024 EUR 454.824
2025 EUR 491.435

Composition of residents

Age build-up

65+: 52 0-15: 16 15-25: 16 25-45: 38 45-65: 50

Education level

Hoger

7

Praktisch

2

Middelbaar

7

Origin of residents (2025)

Europa

4

Nederland

150

Buiten Europa

12

Housing stock and construction periods

Types of homes

Vrijstaande woningen 61
Twee-onder-één-kap woningen 8

Construction period of buildings

Voor 1700 0
1700 tot 1900 4
1900 tot 1925 20
1925 tot 1950 15
1950 tot 1970 10
1970 tot 1980 7
1980 tot 1990 5
1990 tot 2000 5
2000 tot 2010 29
2010 tot 2020 3
2020 en later 3

Energy and sustainability

Energy label distribution

Label G

28

Label A

20

Label B

10

Label D

6

Label F

6

Label C

5

Label E

2

Label A++

1

Label A+++

1

Label A+

0

Label A++++

0

Label A+++++

0

Average energy consumption per year

Average energy consumption per year in Dieverbrug
Year Gas (m3) Electricity (kWh)
2020 1.938 3.800
2021 2.213 3.971
2022 1.765 3.793
2023 1.334 3.603
2024 1.284 3.943

Consumption per house type

Huurwoning

Gas: 1.610 • Electricity: 3.641

Koopwoning

Gas: 1.325 • Electricity: 3.610

Appartement

Gas: 15 • Electricity: 369

Vrijstaande woning

Gas: 1.383 • Electricity: 3.643

Twee-onder-één-kap woning

Gas: 1.095 • Electricity: 3.219

Business activity in Dieverbrug (2025)

Handel en HORECA 15
Nijverheid en energie 8
Zakelijke dienstverlening 9
Overheid, onderwijs en zorg 7
Landbouw, bosbouw en visserij 4
Vervoer, informatie en communicatie 3
Financiele diensten en onroerendgoed 3
Cultuur, recreatie en overige diensten 8

Total number of company establishments: 54

Recent crime statistics

Recent crime statistics in Dieverbrug
Period Crimes
jan 2026 0
jul 2025 1
jun 2025 1
mei 2025 0
mrt 2025 1
mrt 2026 0
nov 2024 0
nov 2025 1
okt 2024 1
okt 2025 0
sep 2024 0
sep 2025 3

These figures give an indicative picture of safety trends in the living environment of Dieverbrug.

Frequently asked questions about living in Dieverbrug

Short answers based on current local statistics, handy for a quick comparison of the living environment.

Hoeveel inwoners heeft Dieverbrug?

Dieverbrug telt in 2026 ongeveer 164 inwoners.

Wat is de gemiddelde WOZ-waarde in Dieverbrug?

De gemiddelde WOZ-waarde in Dieverbrug is in 2025 circa € 491.435.

Wat is het gemiddelde inkomen per inwoner in Dieverbrug?

Het gemiddelde inkomen per inwoner in Dieverbrug ligt rond € 36.249 per jaar.

Hoe veilig is wonen in Dieverbrug?

Voor het huidige jaar gaat het om ongeveer 13 geregistreerde misdrijven. Gebruik deze cijfers als indicatie en vergelijk trends per periode.

Welke woningtypen komen het meest voor in Dieverbrug?

In Dieverbrug komt vooral "Vrijstaande woningen" veel voor, met ongeveer 61 woningen.

Receive free, non-binding quotes

Compare multiple real estate agents and choose the best match.