Residents
325
Last year: 2025
9536PG Ees • Drenthe
€ 249.000 k.k.
Cost of copper (estimated): € 6.830
2% transfer tax (€ 4.980) + notary (€ 1.150) + valuation (€ 700)
Total incl. VAT: € 255.830
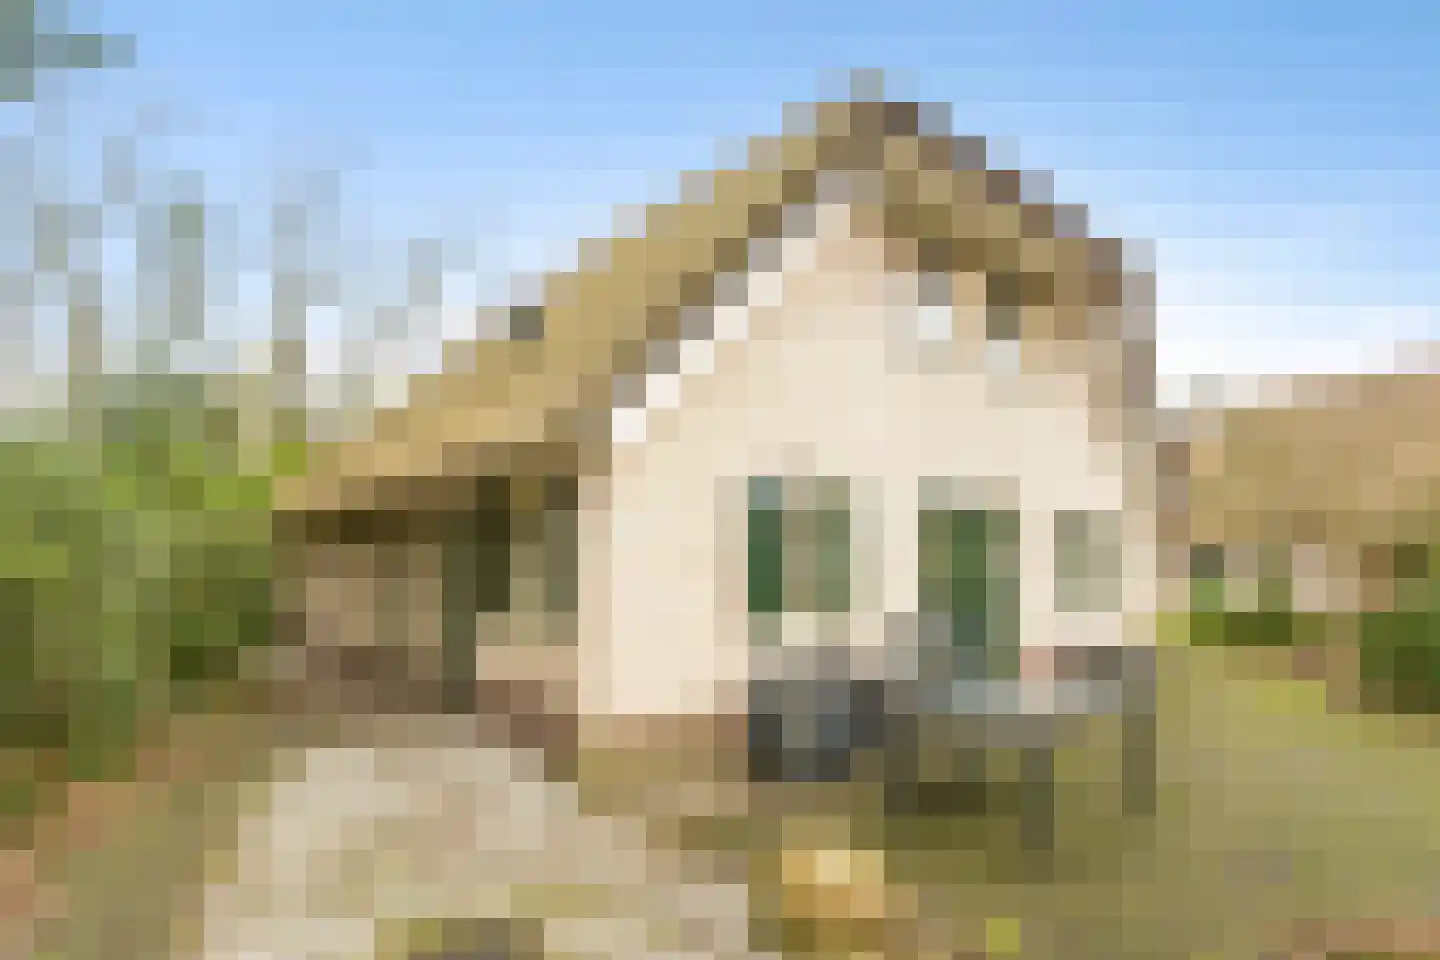
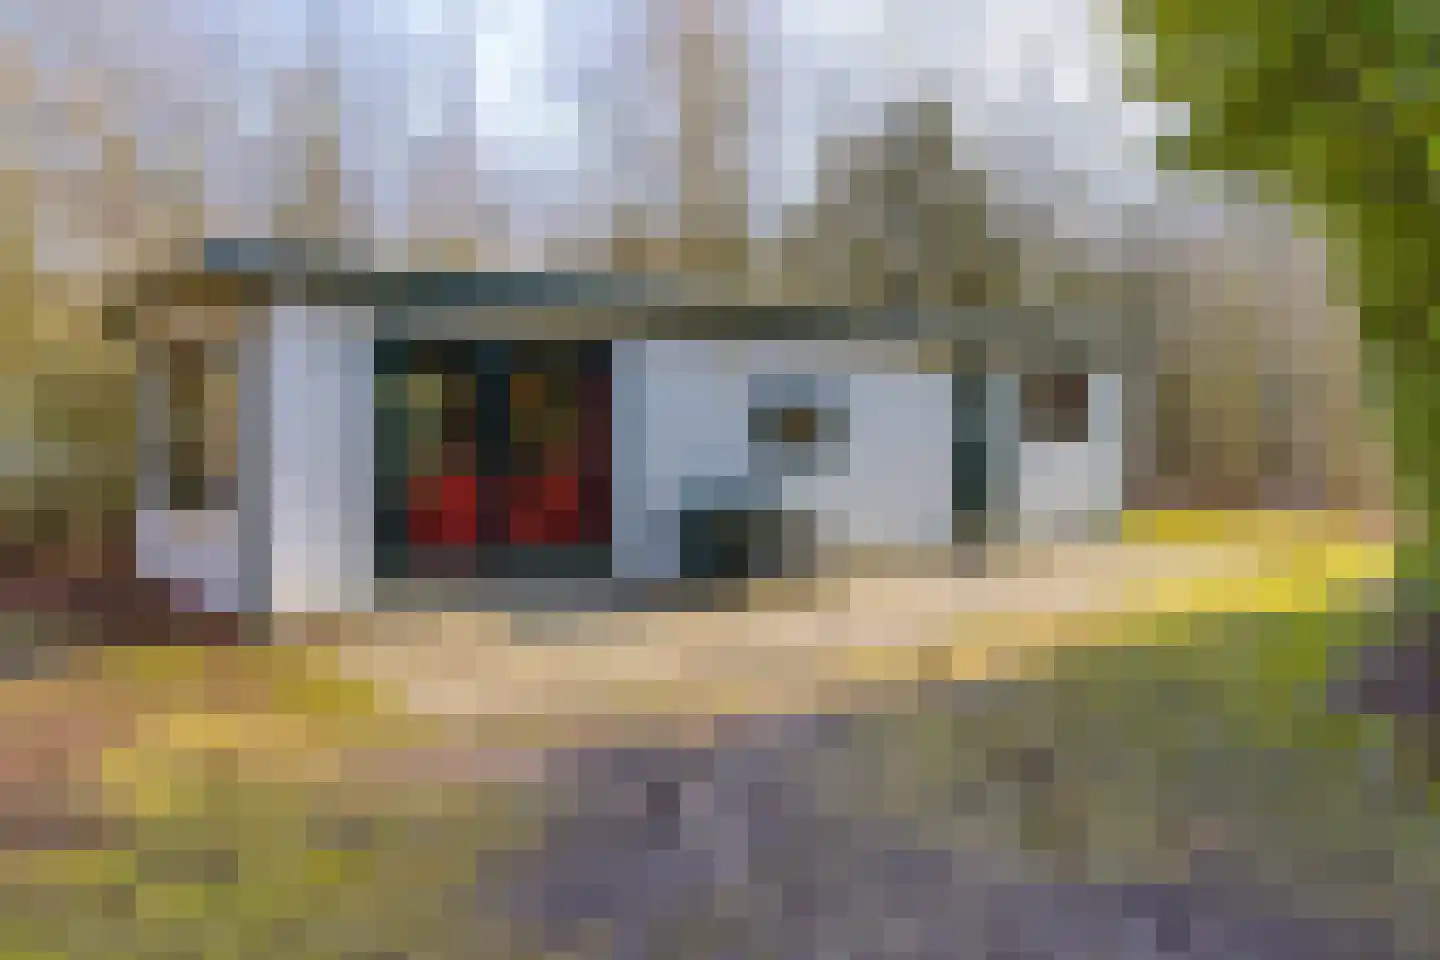
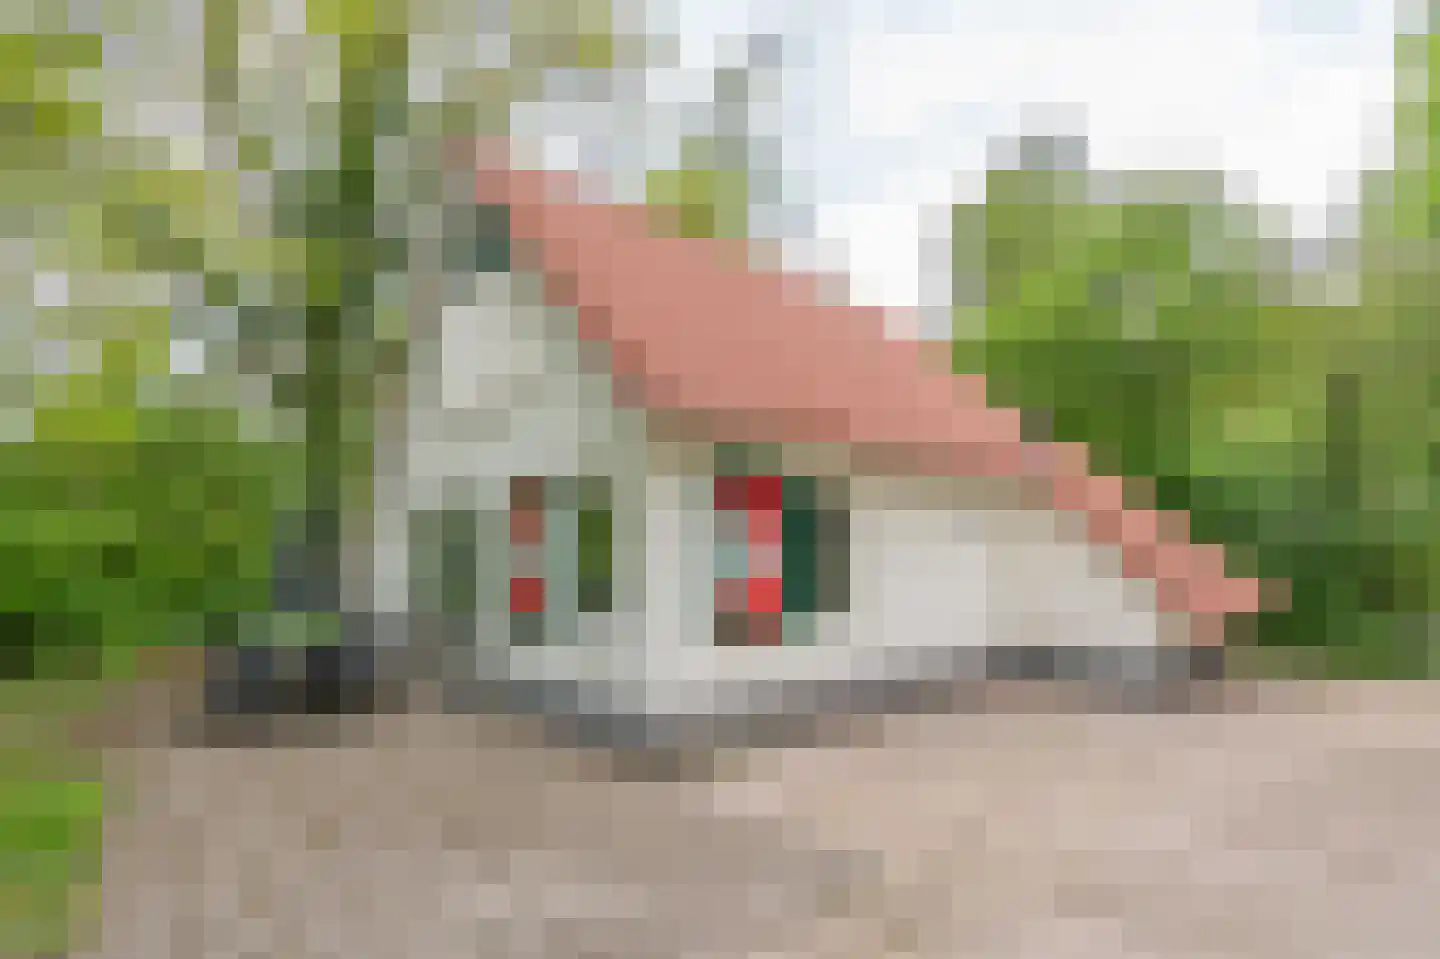
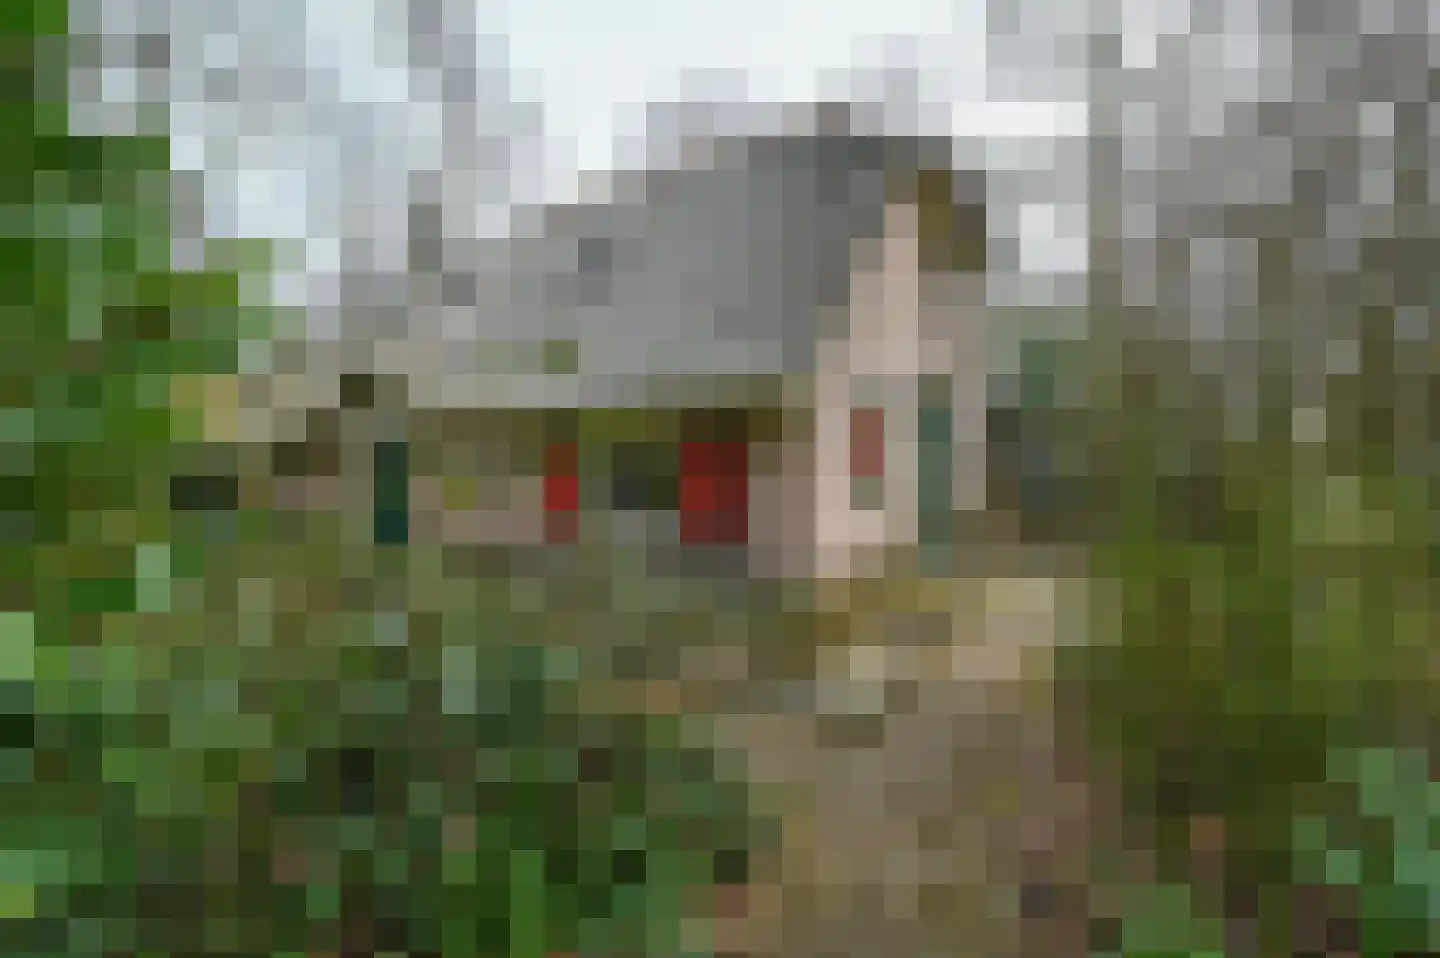
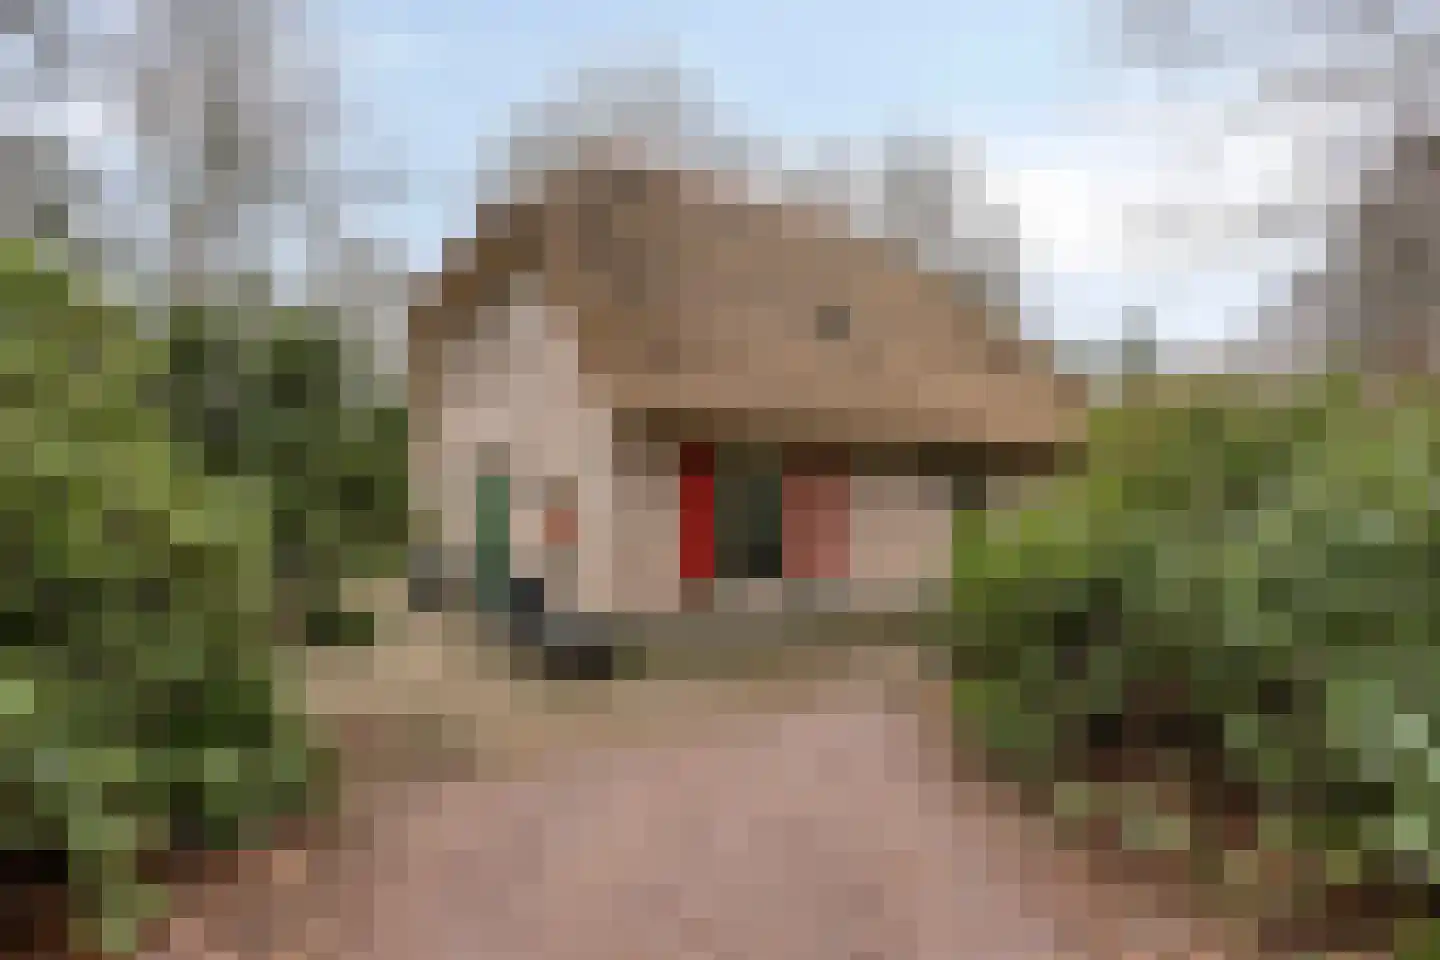
De drukte ontvluchten en heerlijk tot rust komen in uw eigen recreatiewoning? Een vrijstaande recreatiewoning, gelegen op een royaal perceel eigen grond te midden van de Drentse bebossing, het kan! Deze 6-persoons recreatiewoning is gelegen op Landal het Land van Bartje aan de populaire zandspeelvlakte op het park. Een mooi en veel bezocht recreatiepark geschikt voor jong en oud. Landal het Land van Bartje is een verrassend recreatiepark met verschillende type accommodaties. De meest voorkomende accommodaties zijn in landelijke stijl met rieten daken, zo ook deze recreatiewoning. Het recreatiepark heeft veel te bieden voor de gasten. Zo is er een heerlijk restaurant, een parkshop, een ponyranch en onder andere een zwembad. Verschillende voorzieningen zijn recent vernieuwd en uitgebreid. Daarnaast is er een uitdagende Pumptrack. Medio 2005 is deze recreatiewoning degelijk gebouwd en van verschillende gemakken voorzien. Zo treft u in de recreatiewoning 3 slaapkamers, waarvan een slaapkamer op de begane grond. In de woning zijn twee badkamers waarvan een met sauna. Vanuit de lichte woonkamer betreedt u middels de openslaande deuren het verharde terras. Hier kunt u tijdens de zomerdagen heerlijk genieten van de rust en ruimte die deze omgeving u te bieden heeft. Deze recreatiewoning heeft u een aantrekkelijk verhuurrendement en wordt recreatief verhuurd als type 6DL. Dit type heeft een goede en stabiele bezettingsgraad. Naast de verhuur heeft u als eigenaar de mogelijkheid om zelf van de recreatiewoning te genieten. Dit maakt het geheel een ideale combinatie als zowel een zakelijke investering en eigen genot van een tweede woning. Indeling: Begane grond -> Entree met trapopgang naar verdieping, toilet, ruime woonkamer, recent vernieuwde open keuken, slaapkamer, badkamer, berging. Verdieping -> Overloop, twee ruime slaapkamers, badkamer met sauna Kenmerken: - De zonnebank is vervangen voor een wasmachine-/droger; - Recreatiewoning gelegen op een perceel eigen grond van 719m2 met een open zicht; - De recreatiewoning wordt geheel gemeubileerd verkocht; - De keuken in deze recreatiewoning is in februari 2023 vernieuwd!; - De recreatiewoning wordt rook- en huisdiervrij verhuurd; - Het park wil ook graag dat de recreatiewoningen op niveau blijven, derhalve dienen de komende jaren een aantal investeringen te worden uitgevoerd. Documentatie hierover is op aanvraag te verkrijgen.
€ 249.000
Cost of copper (estimated): € 6.830
2% transfer tax (€ 4.980) + notary (€ 1.150) + valuation (€ 700)
Total purchase (incl. p.p.): € 255.830
3,02%
Yearly
€ 12.450
Direct available
Estimated mortgage
Indicative gross monthly cost
Based on annuity and 30 year term
Indicative net monthly cost
iDisclaimer: this mortgage calculation is a simplified indication based on general assumptions. No rights can be derived from the results shown. Calculated with 10-annual interest (met NHG), automatically determined based on the price limit € 470.000. Source: 10-jaars rente uit mortgage_rates (08-06-2026 03:45).
Sauna, 2 douches, ligbad, 2 wastafels, en toilet
Discover where agents are active in Ees
View current location data on residents, WOZ development, housing stock, energy consumption, business activity and safety in Ees. In 2025 were there 325 residents. The average WOZ value in 2025 is EUR 449.000.
Residents
325
Last year: 2025
Average WOZ
EUR 449.000
Last year: 2025
Average income per person.
EUR 34.100
Source: AllNumbers
Crimes (current year)
11
Total registered
| Year | Residents |
|---|---|
| 2021 | 320 |
| 2022 | 330 |
| 2023 | 335 |
| 2024 | 340 |
| 2025 | 325 |
| Year | Average WOZ |
|---|---|
| 2021 | EUR 312.000 |
| 2022 | EUR 344.000 |
| 2023 | EUR 412.000 |
| 2024 | EUR 423.000 |
| 2025 | EUR 449.000 |
Hoger
90
Praktisch
60
Middelbaar
90
Europa
5
Nederland
305
Buiten Europa
15
Label B
180
Label C
90
Label A
83
Label G
39
Label D
28
Label F
17
Label E
14
Label A+
2
Label A++
1
Label A+++
0
Label A++++
0
Label A+++++
0
| Year | Gas (m3) | Electricity (kWh) |
|---|---|---|
| 2020 | 1.980 | 3.500 |
| 2021 | 2.200 | 3.490 |
| 2022 | 1.670 | 3.270 |
| 2023 | 1.430 | 3.200 |
| 2024 | 1.310 | 3.330 |
Huurwoning
Gas: 1.250 • Electricity: 2.240
Koopwoning
Gas: 1.450 • Electricity: 3.340
Appartement
Gas: 690 • Electricity: 1.450
Vrijstaande woning
Gas: 1.510 • Electricity: 3.510
Twee-onder-één-kap woning
Gas: 1.090 • Electricity: 1.700
Total number of company establishments: 55
| Period | Crimes |
|---|---|
| jan 2025 | 2 |
| jan 2026 | 0 |
| jul 2025 | 3 |
| jun 2025 | 1 |
| mei 2025 | 0 |
| mrt 2025 | 0 |
| nov 2024 | 2 |
| nov 2025 | 2 |
| okt 2024 | 3 |
| okt 2025 | 0 |
| sep 2024 | 3 |
| sep 2025 | 1 |
These figures give an indicative picture of safety trends in the living environment of Ees.
Short answers based on current local statistics, handy for a quick comparison of the living environment.
Ees telt in 2025 ongeveer 325 inwoners.
De gemiddelde WOZ-waarde in Ees is in 2025 circa € 449.000.
Het gemiddelde inkomen per inwoner in Ees ligt rond € 34.100 per jaar.
Voor het huidige jaar gaat het om ongeveer 11 geregistreerde misdrijven. Gebruik deze cijfers als indicatie en vergelijk trends per periode.
In Ees komt vooral "Vrijstaande woningen" veel voor, met ongeveer 127 woningen.
View more homes in this location.
9536PG Ees
€ 39.500 k.k.
9536PG Ees
€ 185.000 k.k.
9536PJ Ees
€ 325.000 k.k.
€ 2.664/m²
9536PG Ees
€ 198.000 k.k.
9536PG Ees
€ 115.000 k.k.
9536PC Ees
€ 849.500 k.k.
€ 3.293/m²
9536PG Ees
€ 225.000 k.k.
€ 2.743/m²
9536PG Ees
€ 197.500 k.k.
€ 1.845/m²
