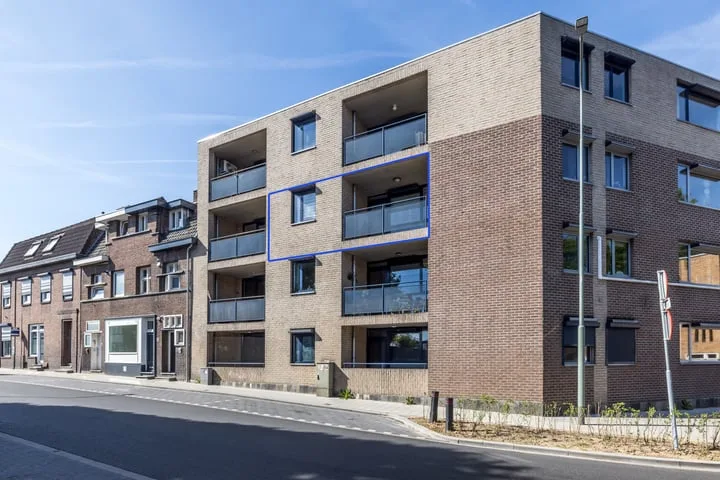
- Sold
Laurastraat 62
6471JM Eygelshoven
€ 397.500 k.k.
€ 2.271/m²
- Living area
- 175 m²
- Land area
- 471 m²
- Bedrooms
- 2
View 66 sold houses in Eygelshoven
Type to search. Use arrow down and arrow up to navigate through results and press Enter to open.
Hidden search suggestions.
Compare sold homes in Eygelshoven or view the current offering in this location directly.
On this page you will find recently sold homes in Eygelshoven. Use this overview to better estimate selling prices, popular neighborhoods, and the local housing supply before you choose a real estate agent. Also view the current housing supply with 96 houses in Eygelshoven.
6471JM Eygelshoven
€ 397.500 k.k.
€ 2.271/m²
6471AZ Eygelshoven
€ 198.000 k.k.
€ 1.816/m²
6471AB Eygelshoven
€ 275.000 k.k.
€ 3.273/m²
6471XK Eygelshoven
€ 398.000 k.k.
€ 3.491/m²
6471XH Eygelshoven
€ 295.000 k.k.
€ 2.418/m²
6471KJ Eygelshoven
€ 349.000 k.k.
€ 2.792/m²
6471BJ Eygelshoven
€ 165.000 k.k.
€ 2.260/m²
6471VN Eygelshoven
€ 298.000 k.k.
€ 3.072/m²
6471EC Eygelshoven
€ 229.000 k.k.
€ 2.462/m²
6471AW Eygelshoven
€ 289.000 k.k.
€ 2.805/m²
Bekijk recente verkopen en ontvang gratis offertes van lokale verkoopmakelaars in Eygelshoven.
Zelf je woning verkopen in Eygelshoven? Vergelijk verkoopmakelaars in Eygelshoven of bekijk de beste verkoopmakelaars in Eygelshoven als referentie bij jouw keuze.
Makelaars maken scherpere voorstellen als ze weten dat je vergelijkt — vraag offertes aan voor verkoop of aankoop.
Short answers about housing prices, sold homes and comparing real estate agents in Eygelshoven.
The costs of a real estate agent in Eygelshoven vary per office, property type and sales approach. Therefore, compare multiple quotes and also look at the real estate agents in Eygelshoven to better compare rates, presentation and local experience.
On this page we currently show 66 sold houses in Eygelshoven from our selection. This helps you to better assess recent transactions and the local housing market.
Houses sold in Eygelshoven give insight into asking prices, house types and neighborhoods where recent transactions have taken place. Compare this also with the current housing stock in Eygelshoven to better understand the market.
You can use sold homes as a first market indication, but a local real estate agent can better take into account finishing, location, maintenance and current demand in Eygelshoven.
Vergelijk makelaars in Eygelshoven op lokale verkoopervaring, reviews, verwachte opbrengst, courtage en marketingaanpak. Bekijk verkoopmakelaars in Eygelshoven of de top 10 makelaars in Eygelshoven om snel sterke kantoren te ontdekken.
View current location data on residents, WOZ development, housing stock, energy consumption, business activity and safety in Eygelshoven. In 2026 were there 5.772 residents. The average WOZ value in 2025 is EUR 229.283.
These figures help to better assess and compare the housing stock in Eygelshoven with recent sold homes. Orient yourself then on suitable top real estate agents in Eygelshoven for sales advice in this region.
Residents
5.772
Last year: 2026
Average WOZ
EUR 229.283
Last year: 2025
Average income per person.
EUR 29.403
Source: AllNumbers
Crimes (current year)
270
Total registered
| Year | Residents |
|---|---|
| 2021 | 5.879 |
| 2022 | 5.806 |
| 2023 | 5.852 |
| 2024 | 5.775 |
| 2025 | 5.811 |
| 2026 | 5.772 |
| Year | Average WOZ |
|---|---|
| 2021 | EUR 174.809 |
| 2022 | EUR 184.322 |
| 2023 | EUR 215.923 |
| 2024 | EUR 216.664 |
| 2025 | EUR 229.283 |
Hoger
878
Praktisch
1.411
Middelbaar
2.093
Europa
1.226
Nederland
4.022
Buiten Europa
563
Label C
913
Label A
466
Label B
364
Label D
350
Label G
301
Label F
271
Label E
247
Label A+
113
Label A++
5
Label A+++
2
Label A++++
2
Label A+++++
0
| Year | Gas (m3) | Electricity (kWh) |
|---|---|---|
| 2020 | 1.245 | 2.776 |
| 2021 | 1.412 | 2.834 |
| 2022 | 1.105 | 2.717 |
| 2023 | 902 | 2.641 |
| 2024 | 871 | 2.744 |
Hoekwoning
Gas: 961 • Electricity: 2.825
Huurwoning
Gas: 769 • Electricity: 2.131
Koopwoning
Gas: 991 • Electricity: 2.969
Appartement
Gas: 728 • Electricity: 2.002
Tussenwoning
Gas: 858 • Electricity: 2.674
Vrijstaande woning
Gas: 1.288 • Electricity: 3.606
Twee-onder-één-kap woning
Gas: 1.072 • Electricity: 3.061
Total number of company establishments: 521
| Period | Crimes |
|---|---|
| jan 2026 | 16 |
| jul 2025 | 27 |
| jun 2025 | 33 |
| mei 2025 | 26 |
| mrt 2025 | 24 |
| mrt 2026 | 18 |
| nov 2024 | 25 |
| nov 2025 | 34 |
| okt 2024 | 19 |
| okt 2025 | 23 |
| sep 2024 | 21 |
| sep 2025 | 11 |
These figures give an indicative picture of safety trends in the living environment of Eygelshoven.
Short answers based on current local statistics, handy for a quick comparison of the living environment.
Eygelshoven telt in 2026 ongeveer 5.772 inwoners.
De gemiddelde WOZ-waarde in Eygelshoven is in 2025 circa € 229.283.
Het gemiddelde inkomen per inwoner in Eygelshoven ligt rond € 29.403 per jaar.
Voor het huidige jaar gaat het om ongeveer 270 geregistreerde misdrijven. Gebruik deze cijfers als indicatie en vergelijk trends per periode.
In Eygelshoven komt vooral "Tussenwoningen" veel voor, met ongeveer 893 woningen.