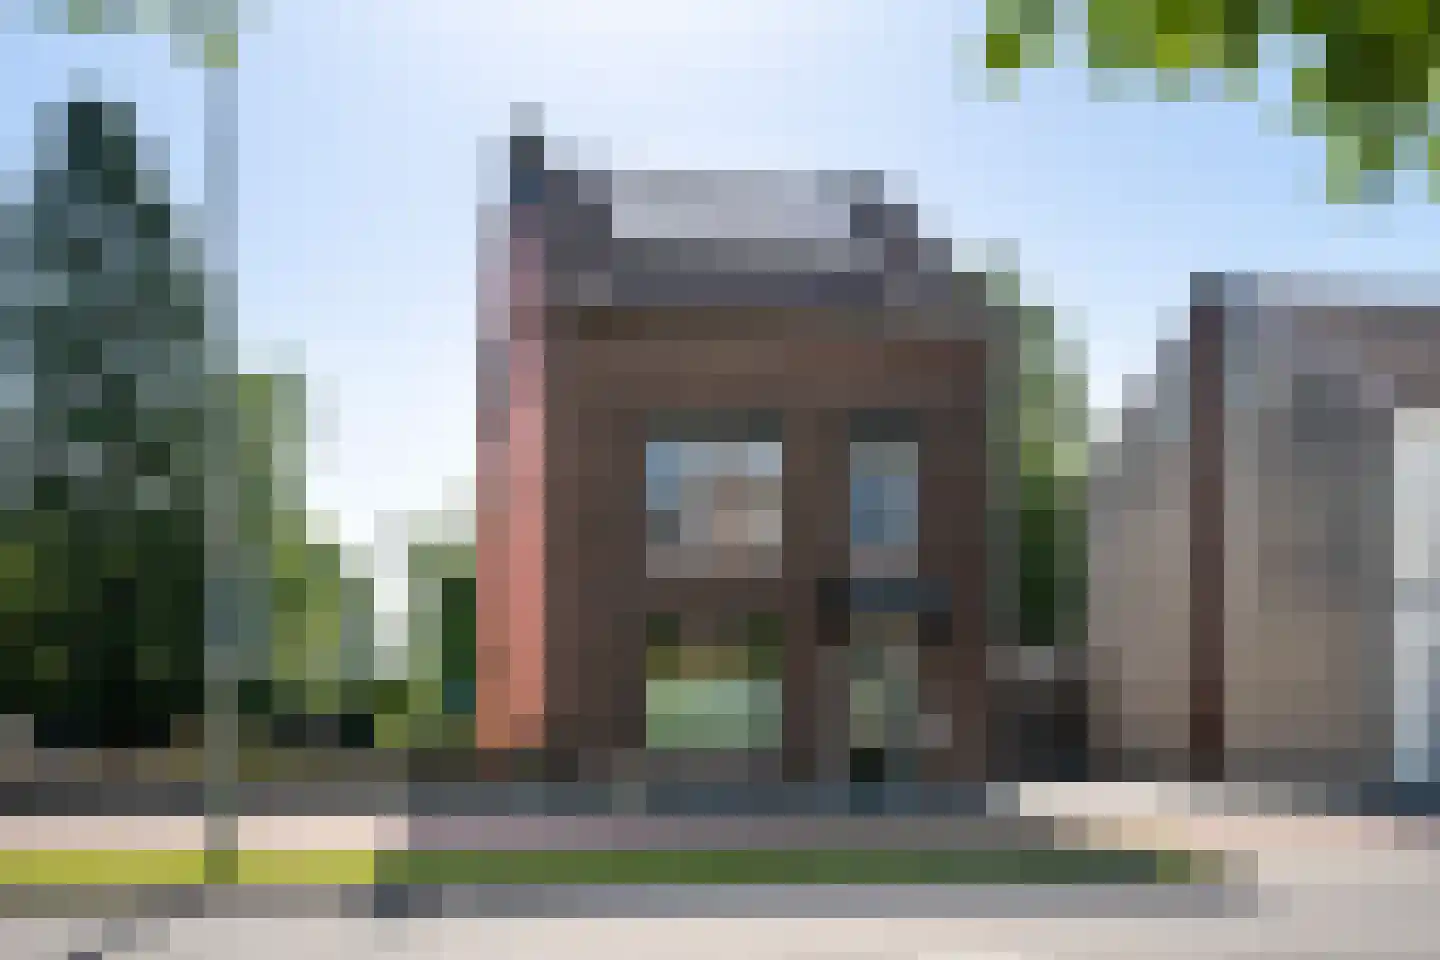
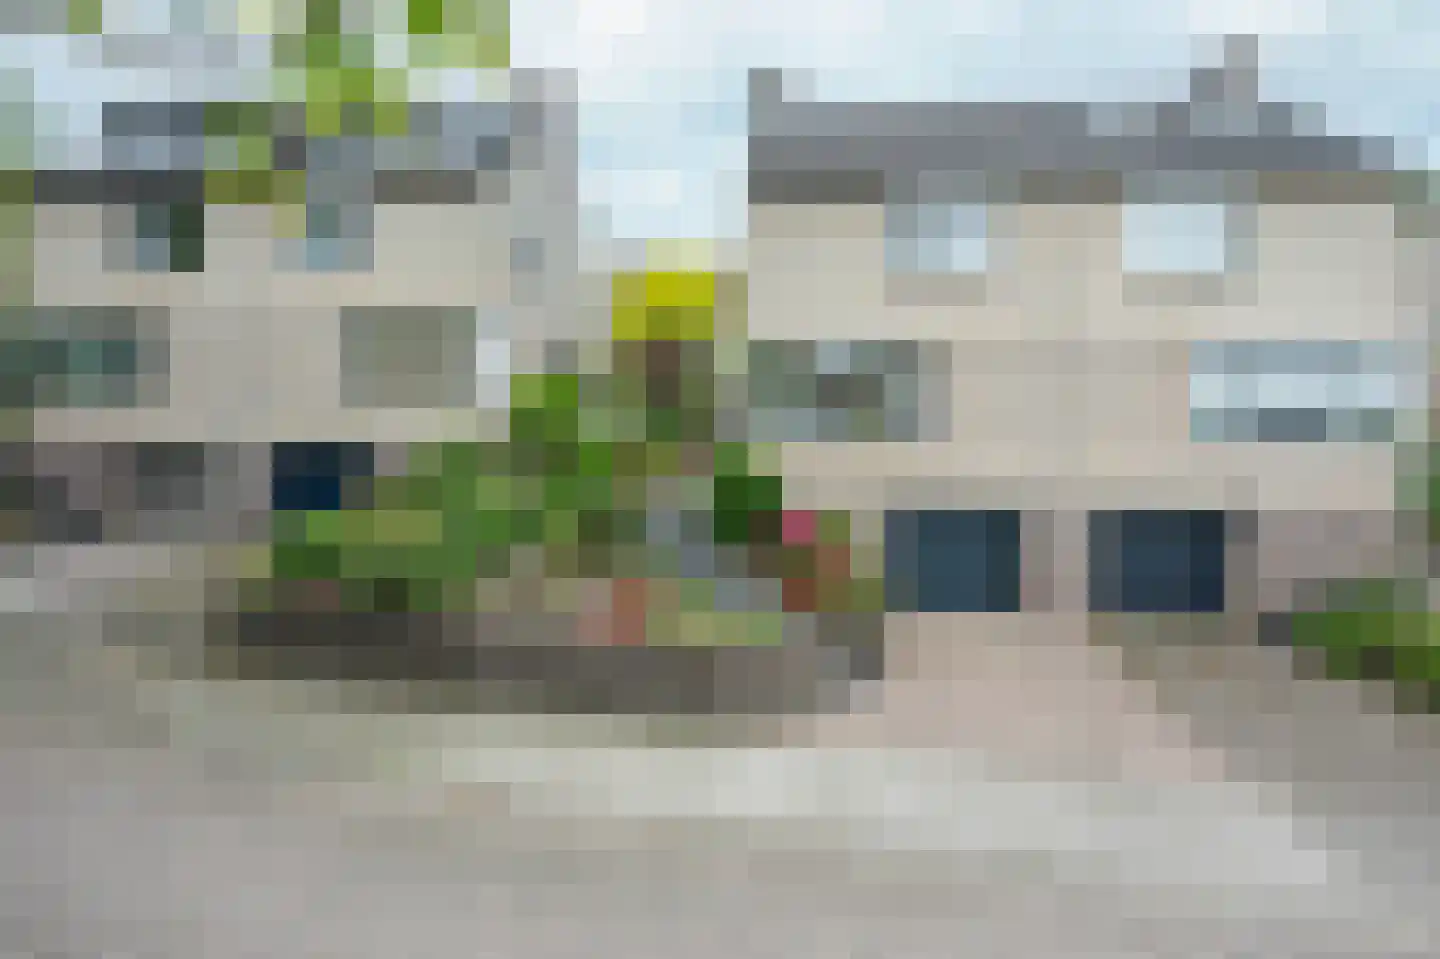
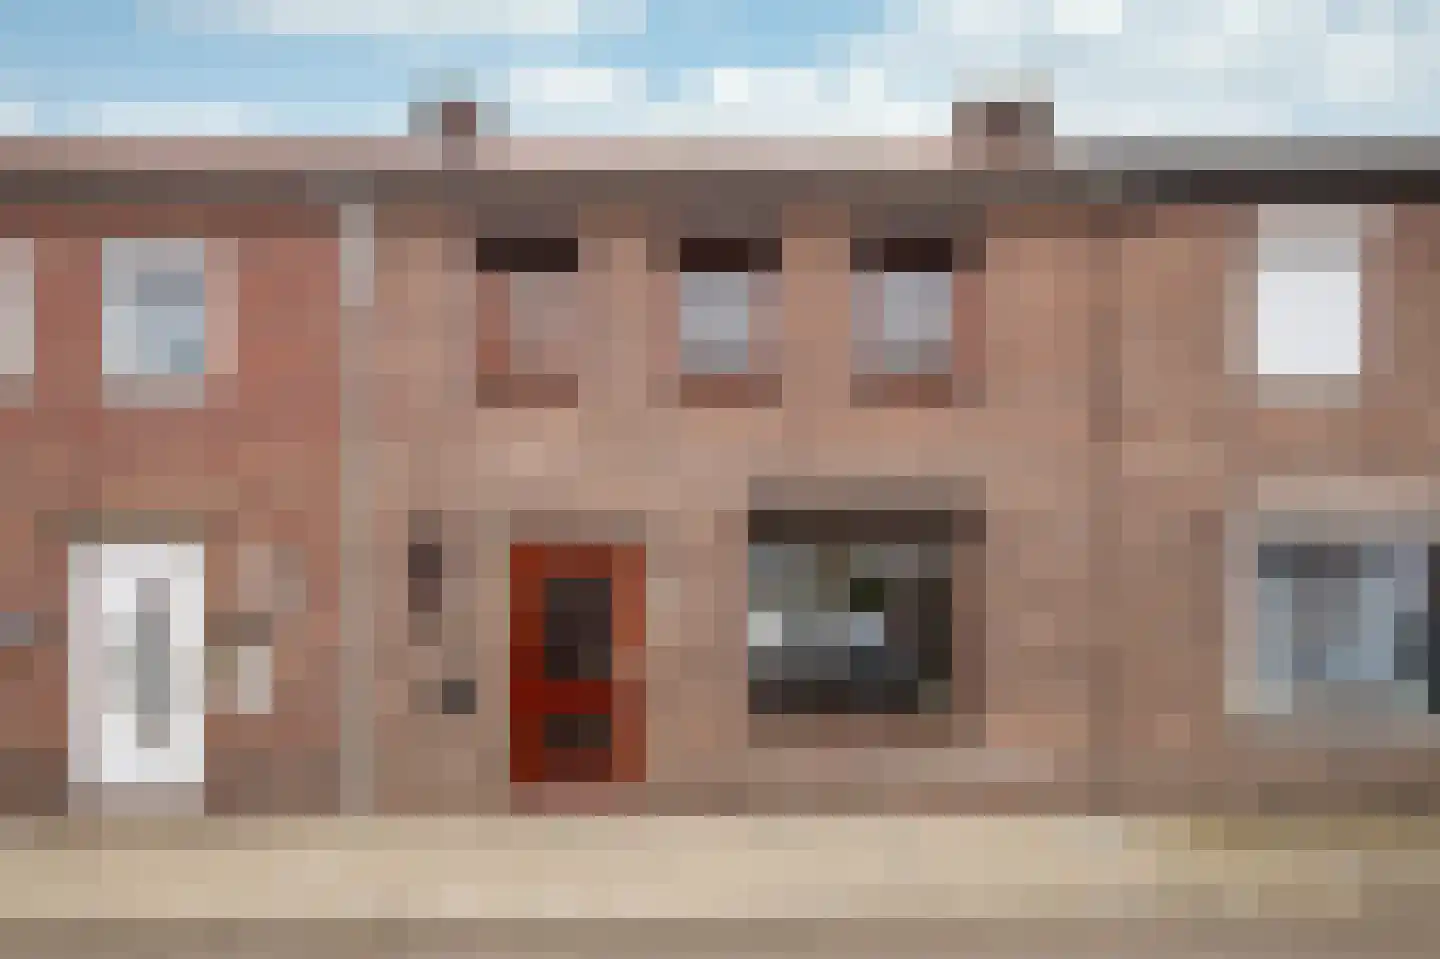
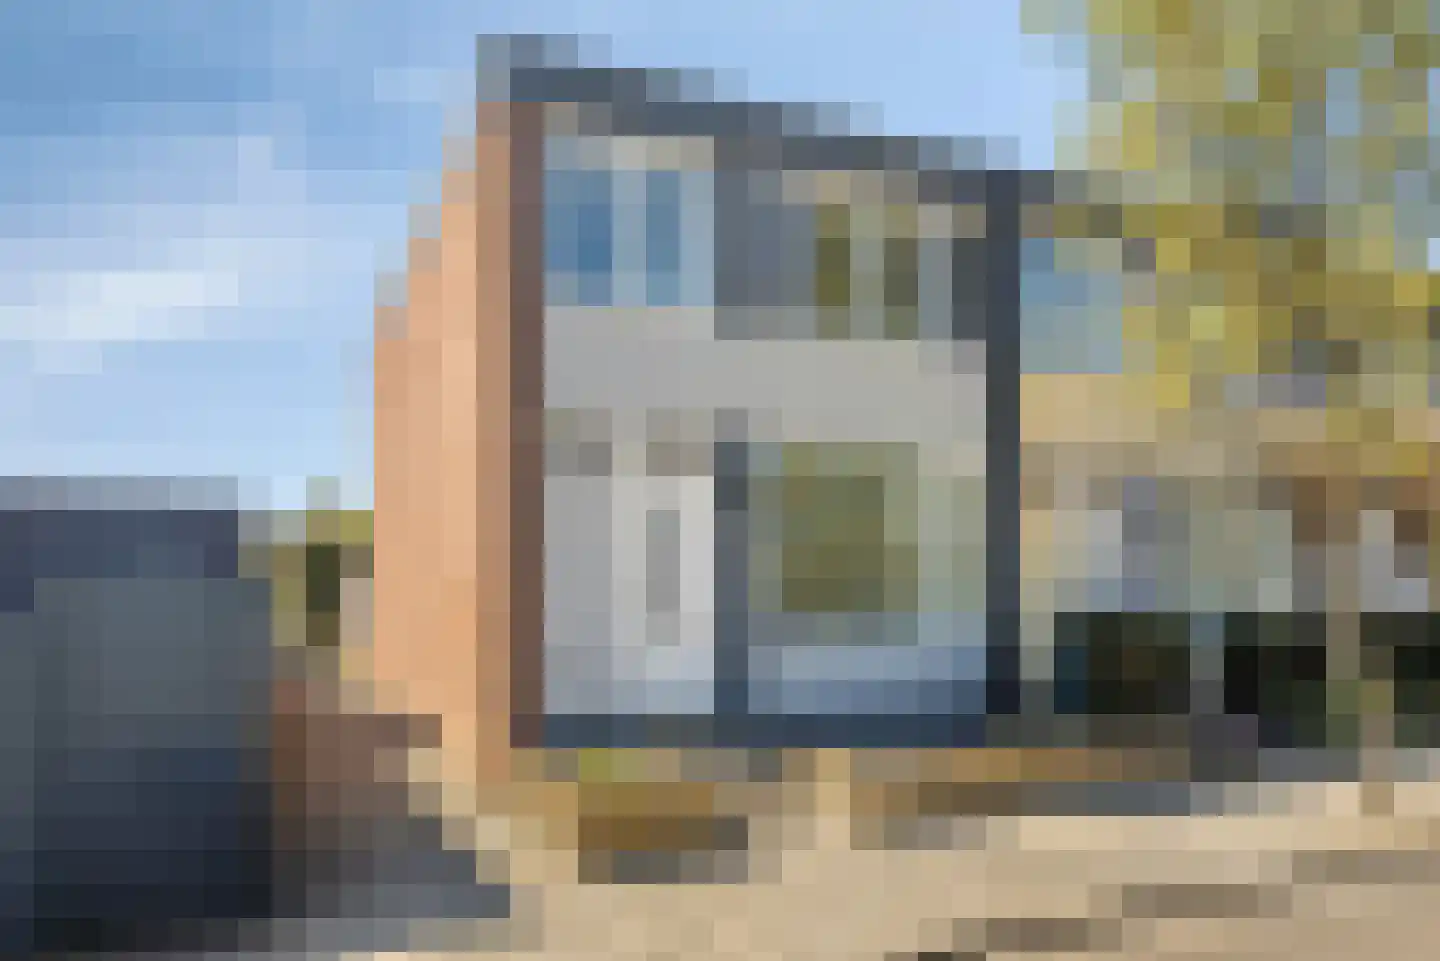
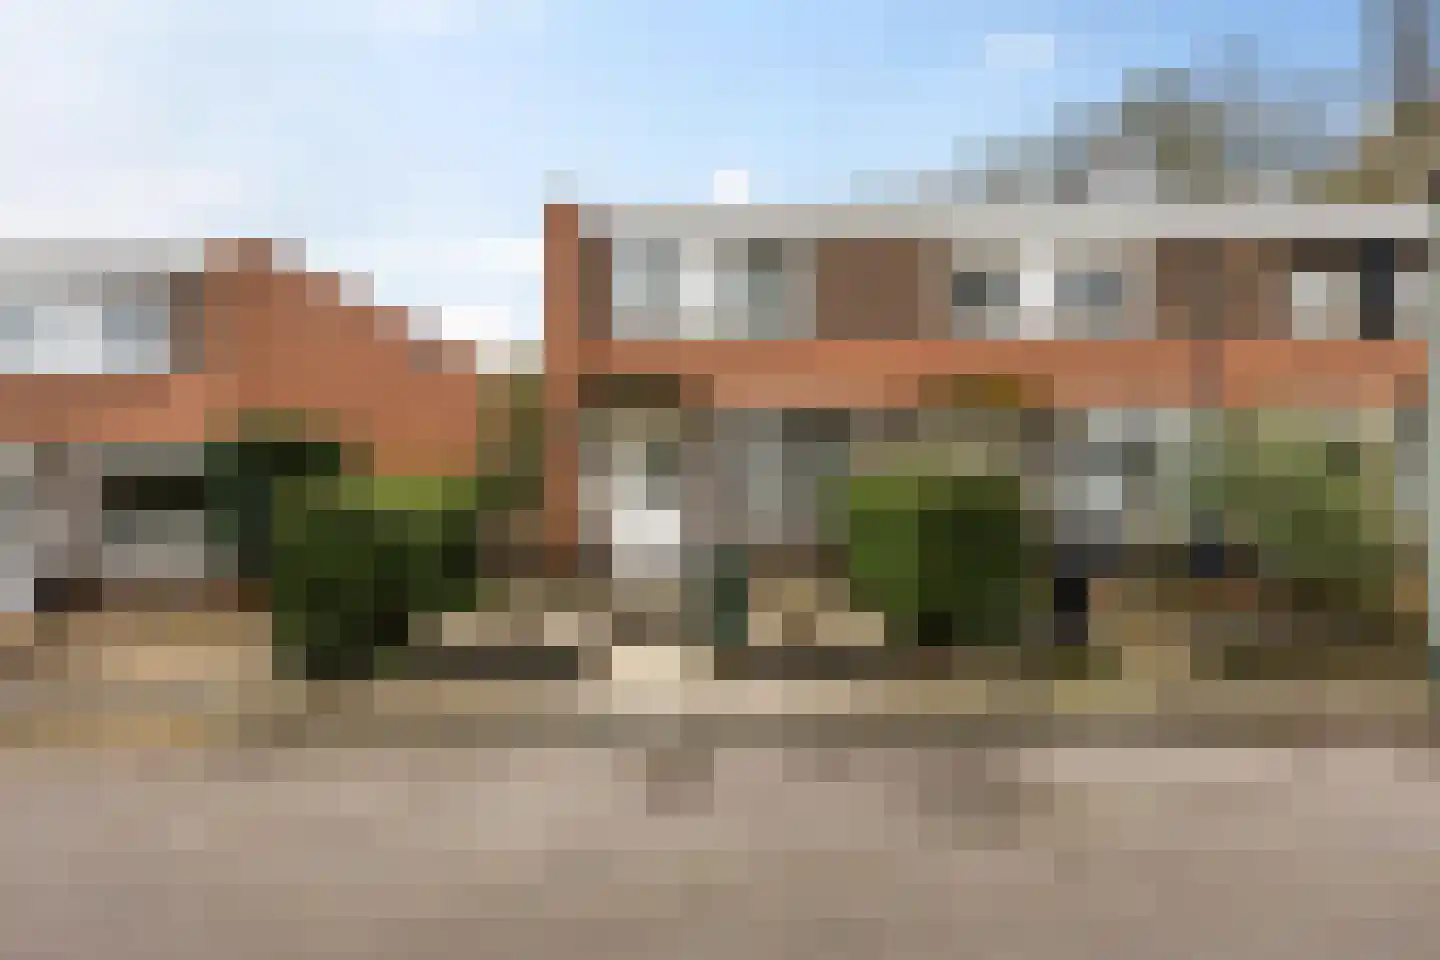
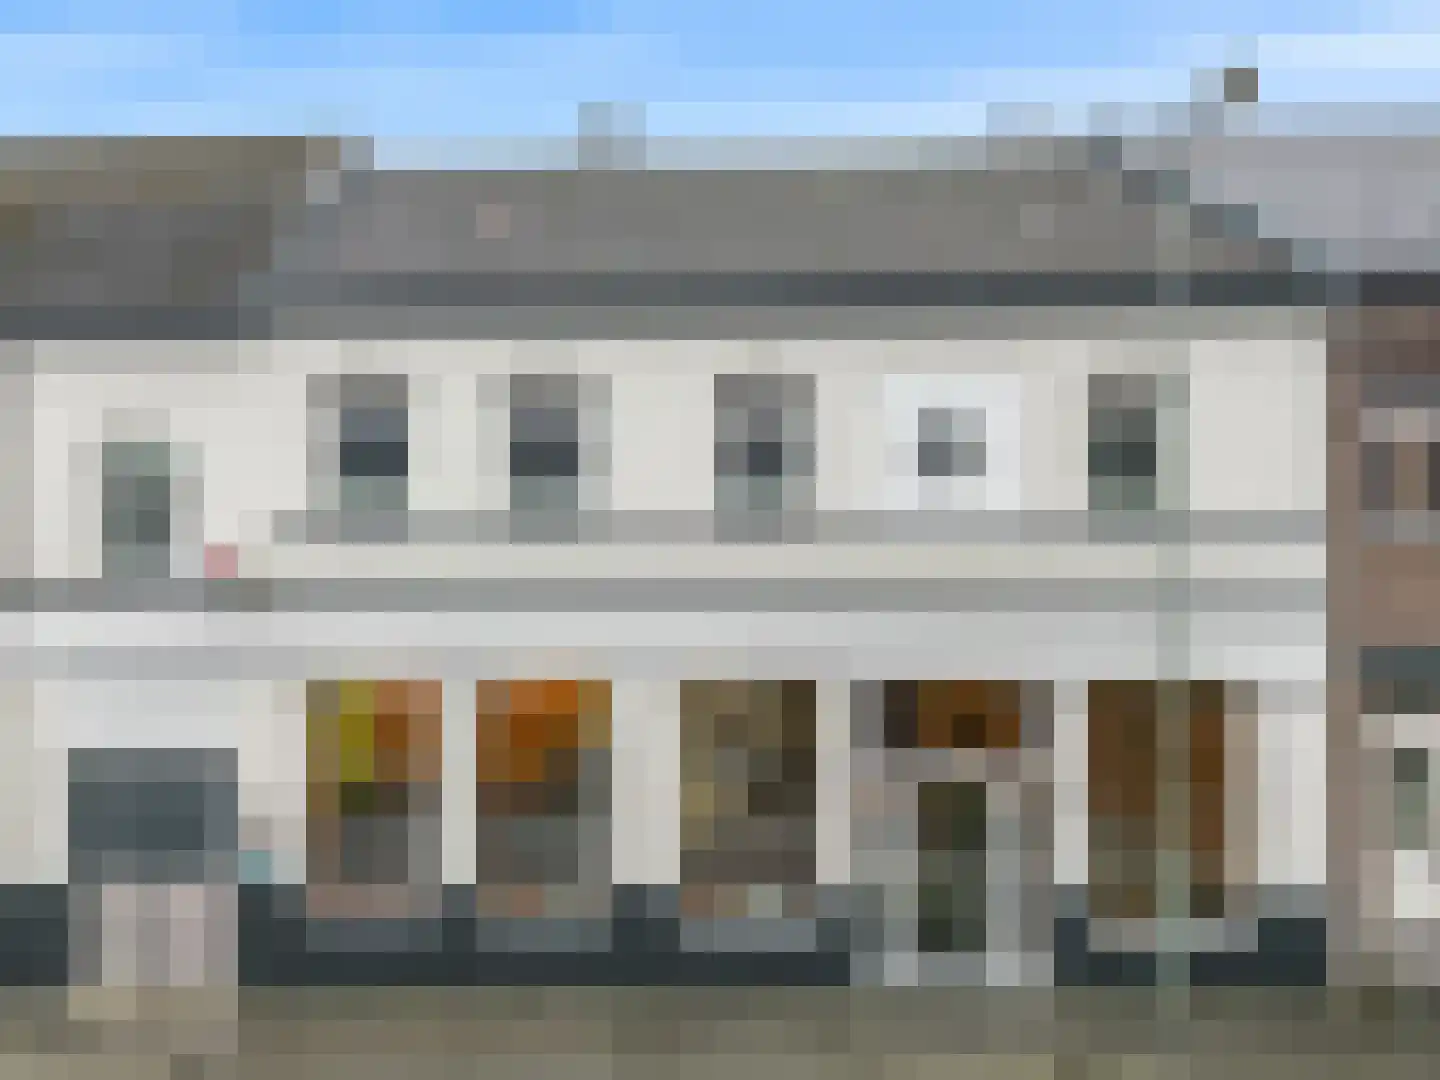
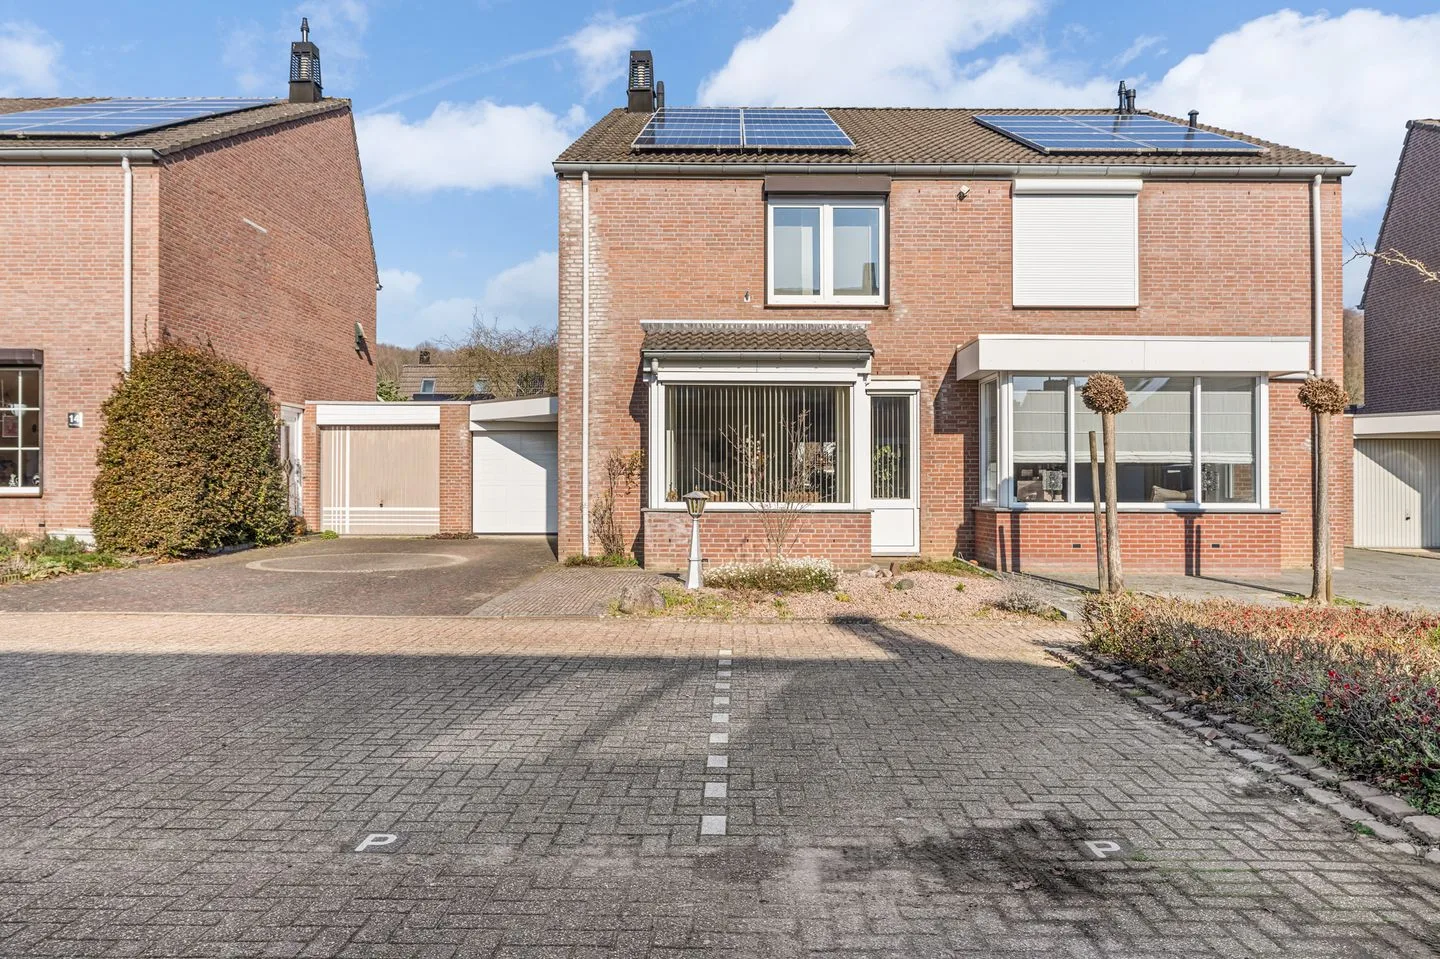
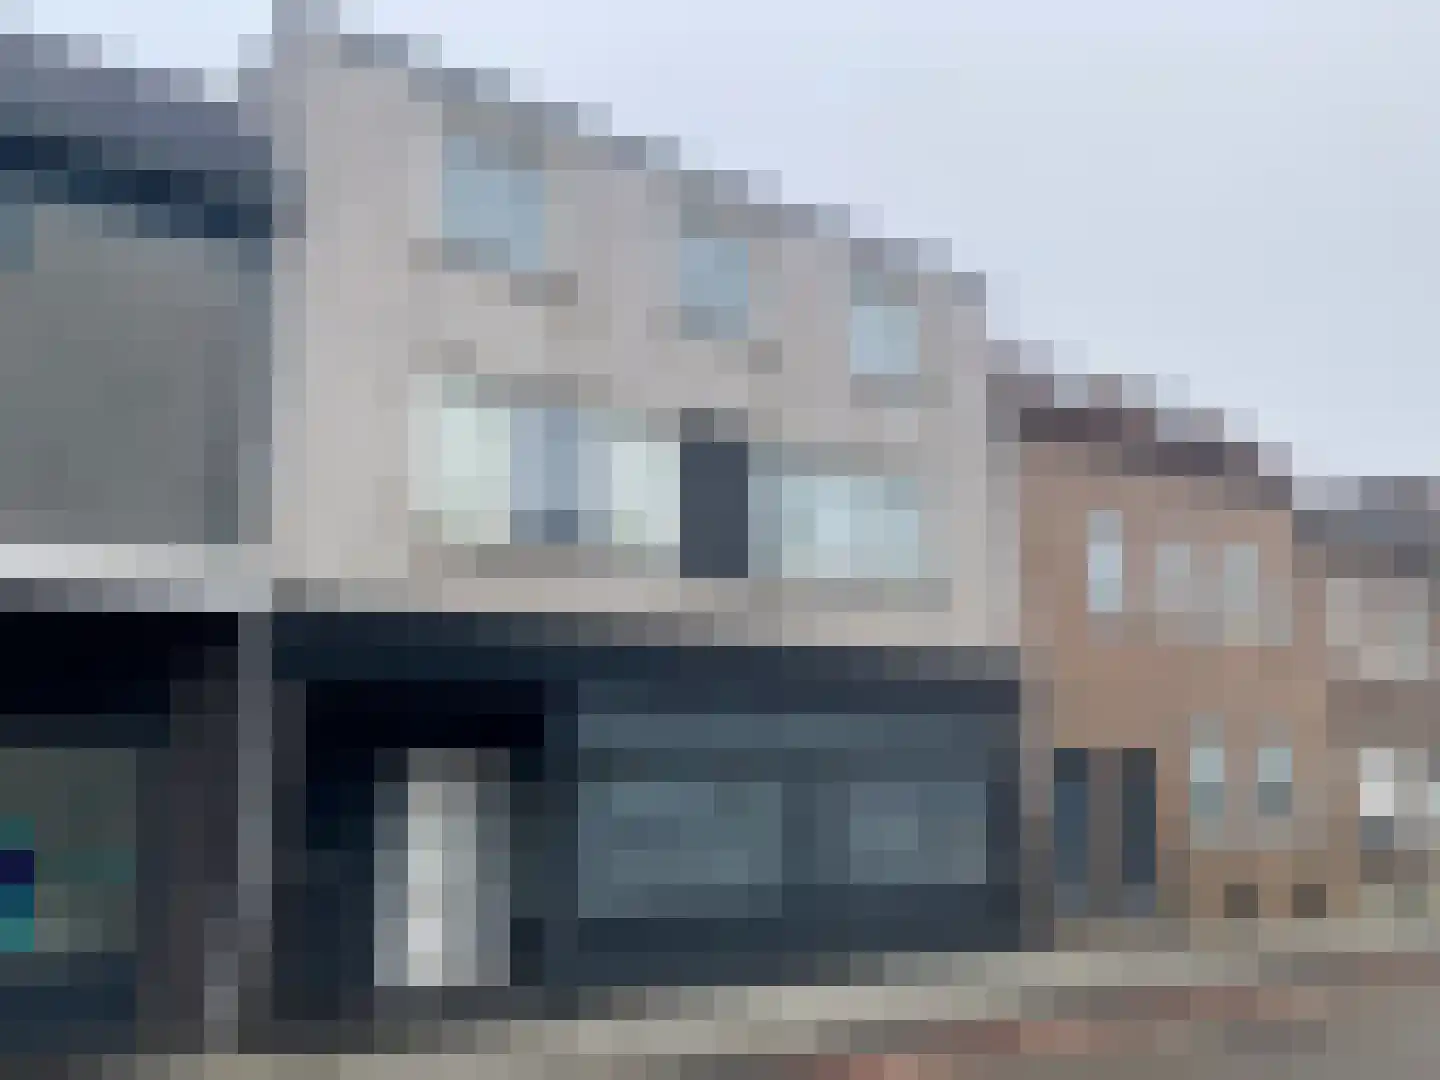
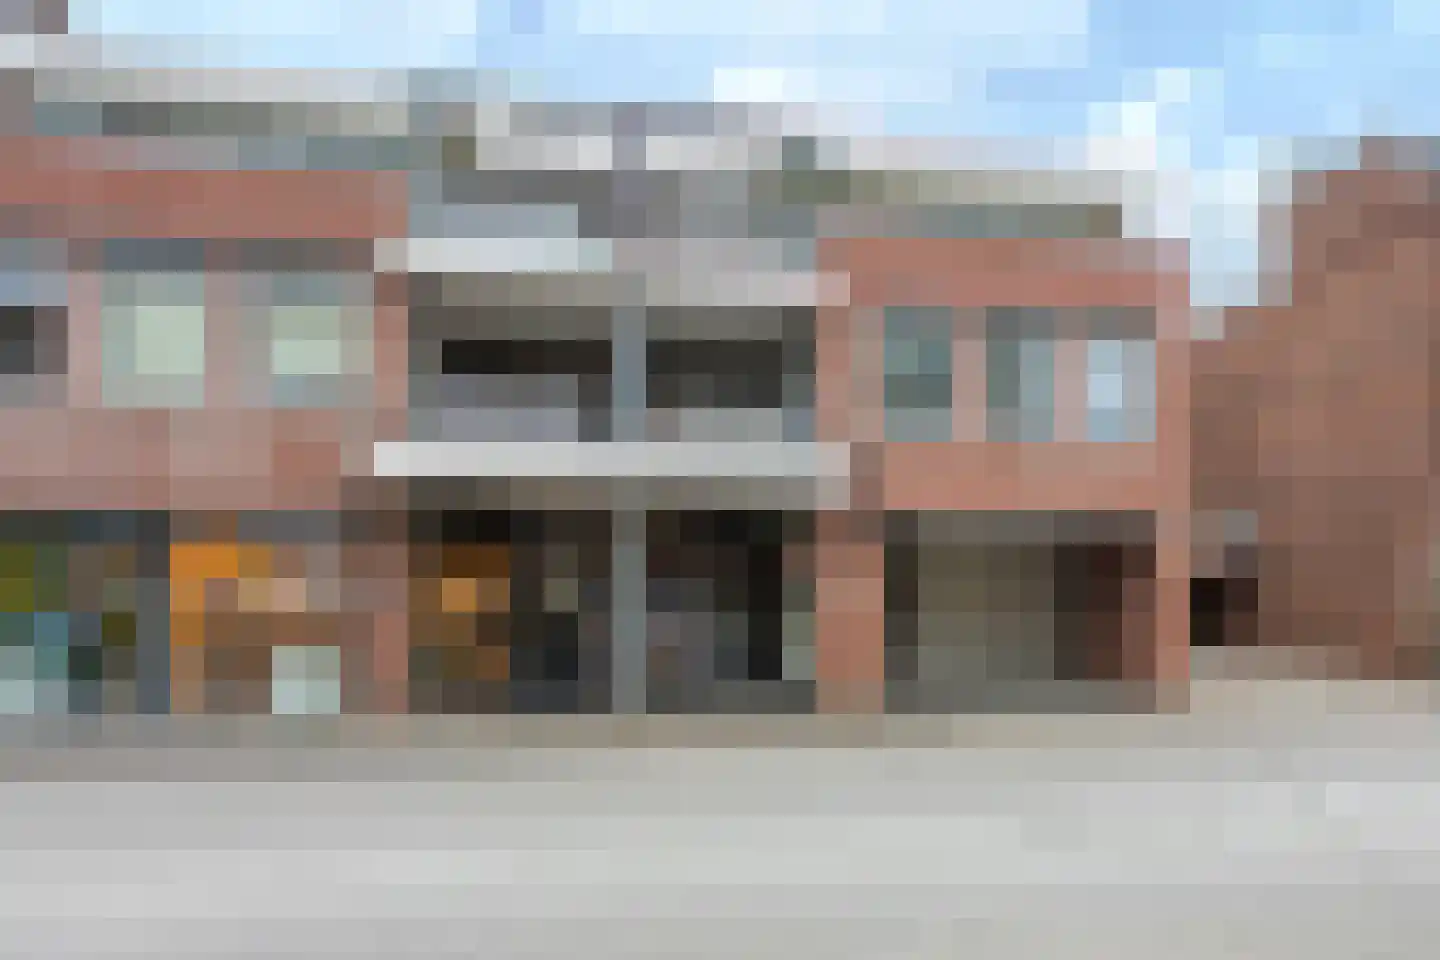
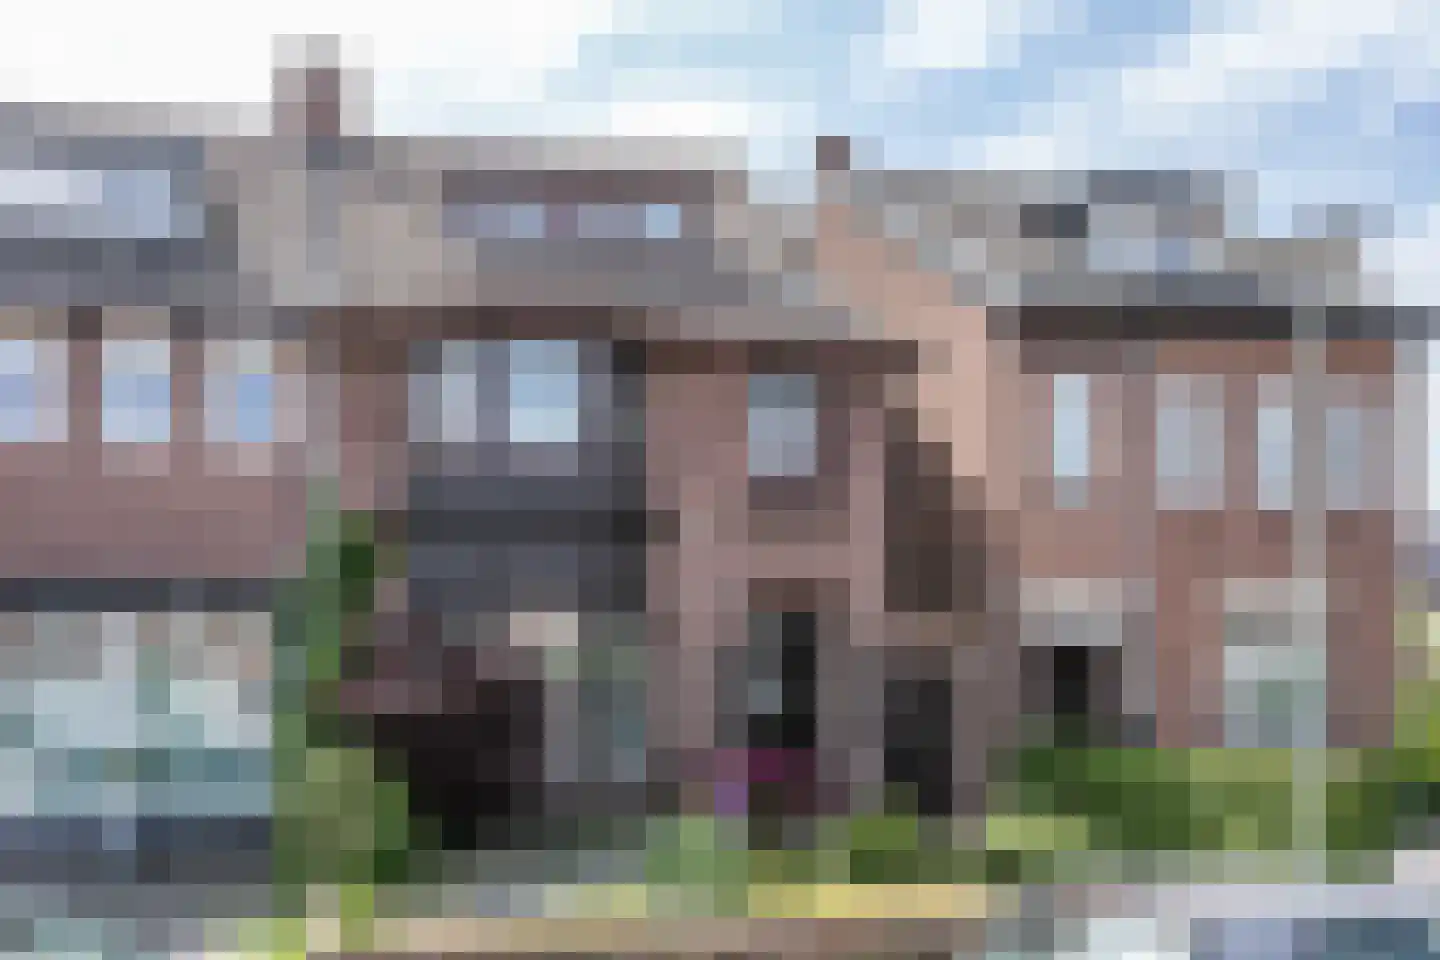
- Available
Coelgroevenstraat 9
6471AW Eygelshoven
€ 259.000 k.k.
€ 1.738/m²
- Living area
- 149 m²
- Land area
- 199 m²
- Bedrooms
- 4
Searching in 92 houses in Eygelshoven
Type to search. Use arrow down and arrow up to navigate through results and press Enter to open.
Hidden search suggestions.
View current properties in Eygelshoven or search targeted on street, postal code and property characteristics.
View the current housing stock in Eygelshoven and quickly filter by price, living area, rooms and more. There are currently 92 houses in this place within our selection. View also 60 sold houses in Eygelshoven for extra insight into the local housing market.
6471AW Eygelshoven
€ 259.000 k.k.
€ 1.738/m²
6471XV Eygelshoven
€ 349.000 k.k.
€ 2.006/m²
6471VT Eygelshoven
€ 319.000 k.k.
€ 3.158/m²
6471EP Eygelshoven
€ 425.000 k.k.
€ 2.833/m²
6471VZ Eygelshoven
€ 449.000 k.k.
€ 2.673/m²
6471BD Eygelshoven
€ 339.000 k.k.
€ 3.139/m²
6471BC Eygelshoven
€ 585.000 k.k.
€ 2.647/m²
6471AB Eygelshoven
€ 349.000 k.k.
€ 2.644/m²
6471CW Eygelshoven
€ 374.500 k.k.
€ 2.229/m²
6471VK Eygelshoven
€ 274.000 k.k.
6471JX Eygelshoven
Price upon request
6471JC Eygelshoven
€ 189.000 k.k.
€ 2.625/m²
6471EK Eygelshoven
€ 878 p/m
€ 12/m²
6471CR Eygelshoven
€ 229.000 k.k.
€ 2.140/m²
6471HP Eygelshoven
€ 229.000 k.k.
€ 2.267/m²
6471JJ Eygelshoven
€ 395.000 k.k.
€ 1.326/m²
6471KJ Eygelshoven
€ 339.000 k.k.
€ 2.690/m²
6471HA Eygelshoven
€ 269.000 k.k.
€ 2.989/m²
6471JR Eygelshoven
€ 435.000 k.k.
€ 2.186/m²
6471AK Eygelshoven
€ 219.000 k.k.
€ 2.258/m²
6471JL Eygelshoven
€ 350.000 k.k.
€ 1.163/m²
6471AG Eygelshoven
€ 499.000 k.k.
€ 2.988/m²
6471HE Eygelshoven
€ 435.000 k.k.
€ 2.339/m²
6471GC Eygelshoven
€ 295.000 k.k.
€ 2.201/m²
6471CE Eygelshoven
€ 315.000 k.k.
€ 2.739/m²
6471EK Eygelshoven
€ 160.000 k.k.
€ 2.162/m²
6471KD Eygelshoven
€ 269.000 k.k.
€ 3.092/m²
6471KK Eygelshoven
€ 239.000 k.k.
€ 2.464/m²
Get free quotes from real estate agents with local market knowledge. Compare more than 51 real estate agents in Eygelshoven.
Selling a home in Eygelshoven? Compare all real estate agents in Eygelshoven or view the top 10 real estate agents in Eygelshoven for extra context for your choice.
Real estate agents make sharper offers when they know you're comparing — ask for quotes for sale or purchase.
Practical answers about housing supply, sales and comparing real estate agents in Eygelshoven.
The costs of a real estate agent in Eygelshoven depend on commission, setup costs, property presentation and the chosen service. Compare the 51 real estate agents in Eygelshoven via the real estate agent page and request multiple quotes to compare rates and approach well.
Within our selection, we are currently showing 92 houses in Eygelshoven. View also the sold houses in Eygelshoven to compare the current offering with recent transactions.
Take into account not only price and living area but also maintenance, energy label, location, outdoor space and sales status. This way you compare houses in Eygelshoven on more than just the asking price.
A local real estate agent knows the neighborhoods, recent transactions and demand in Eygelshoven. By comparing 51 real estate agents in the region you get a better insight into prices, sales strategy and expected yield; the top 10 in Eygelshoven provides a useful starting point.
Yes, when making a sales plan, a valuation in Eygelshoven is wise. You gain insight into a realistic asking price and can then compare offers from real estate agents specifically.
View current location data on residents, WOZ development, housing stock, energy consumption, business activity and safety in Eygelshoven. In 2026 were there 5.772 residents. The average WOZ value in 2025 is EUR 229.283.
These figures help to better assess and compare the housing stock in Eygelshoven with recent sold homes. Orient yourself then on suitable top real estate agents in Eygelshoven for sales advice in this region.
Residents
5.772
Last year: 2026
Average WOZ
EUR 229.283
Last year: 2025
Average income per person.
EUR 29.403
Source: AllNumbers
Crimes (current year)
270
Total registered
| Year | Residents |
|---|---|
| 2021 | 5.879 |
| 2022 | 5.806 |
| 2023 | 5.852 |
| 2024 | 5.775 |
| 2025 | 5.811 |
| 2026 | 5.772 |
| Year | Average WOZ |
|---|---|
| 2021 | EUR 174.809 |
| 2022 | EUR 184.322 |
| 2023 | EUR 215.923 |
| 2024 | EUR 216.664 |
| 2025 | EUR 229.283 |
Hoger
878
Praktisch
1.411
Middelbaar
2.093
Europa
1.226
Nederland
4.022
Buiten Europa
563
Label C
913
Label A
466
Label B
364
Label D
350
Label G
301
Label F
271
Label E
247
Label A+
113
Label A++
5
Label A+++
2
Label A++++
2
Label A+++++
0
| Year | Gas (m3) | Electricity (kWh) |
|---|---|---|
| 2020 | 1.245 | 2.776 |
| 2021 | 1.412 | 2.834 |
| 2022 | 1.105 | 2.717 |
| 2023 | 902 | 2.641 |
| 2024 | 871 | 2.744 |
Hoekwoning
Gas: 961 • Electricity: 2.825
Huurwoning
Gas: 769 • Electricity: 2.131
Koopwoning
Gas: 991 • Electricity: 2.969
Appartement
Gas: 728 • Electricity: 2.002
Tussenwoning
Gas: 858 • Electricity: 2.674
Vrijstaande woning
Gas: 1.288 • Electricity: 3.606
Twee-onder-één-kap woning
Gas: 1.072 • Electricity: 3.061
Total number of company establishments: 521
| Period | Crimes |
|---|---|
| jan 2026 | 16 |
| jul 2025 | 27 |
| jun 2025 | 33 |
| mei 2025 | 26 |
| mrt 2025 | 24 |
| mrt 2026 | 18 |
| nov 2024 | 25 |
| nov 2025 | 34 |
| okt 2024 | 19 |
| okt 2025 | 23 |
| sep 2024 | 21 |
| sep 2025 | 11 |
These figures give an indicative picture of safety trends in the living environment of Eygelshoven.
Short answers based on current local statistics, handy for a quick comparison of the living environment.
Eygelshoven telt in 2026 ongeveer 5.772 inwoners.
De gemiddelde WOZ-waarde in Eygelshoven is in 2025 circa € 229.283.
Het gemiddelde inkomen per inwoner in Eygelshoven ligt rond € 29.403 per jaar.
Voor het huidige jaar gaat het om ongeveer 270 geregistreerde misdrijven. Gebruik deze cijfers als indicatie en vergelijk trends per periode.
In Eygelshoven komt vooral "Tussenwoningen" veel voor, met ongeveer 893 woningen.