Residents
5.772
Last year: 2026
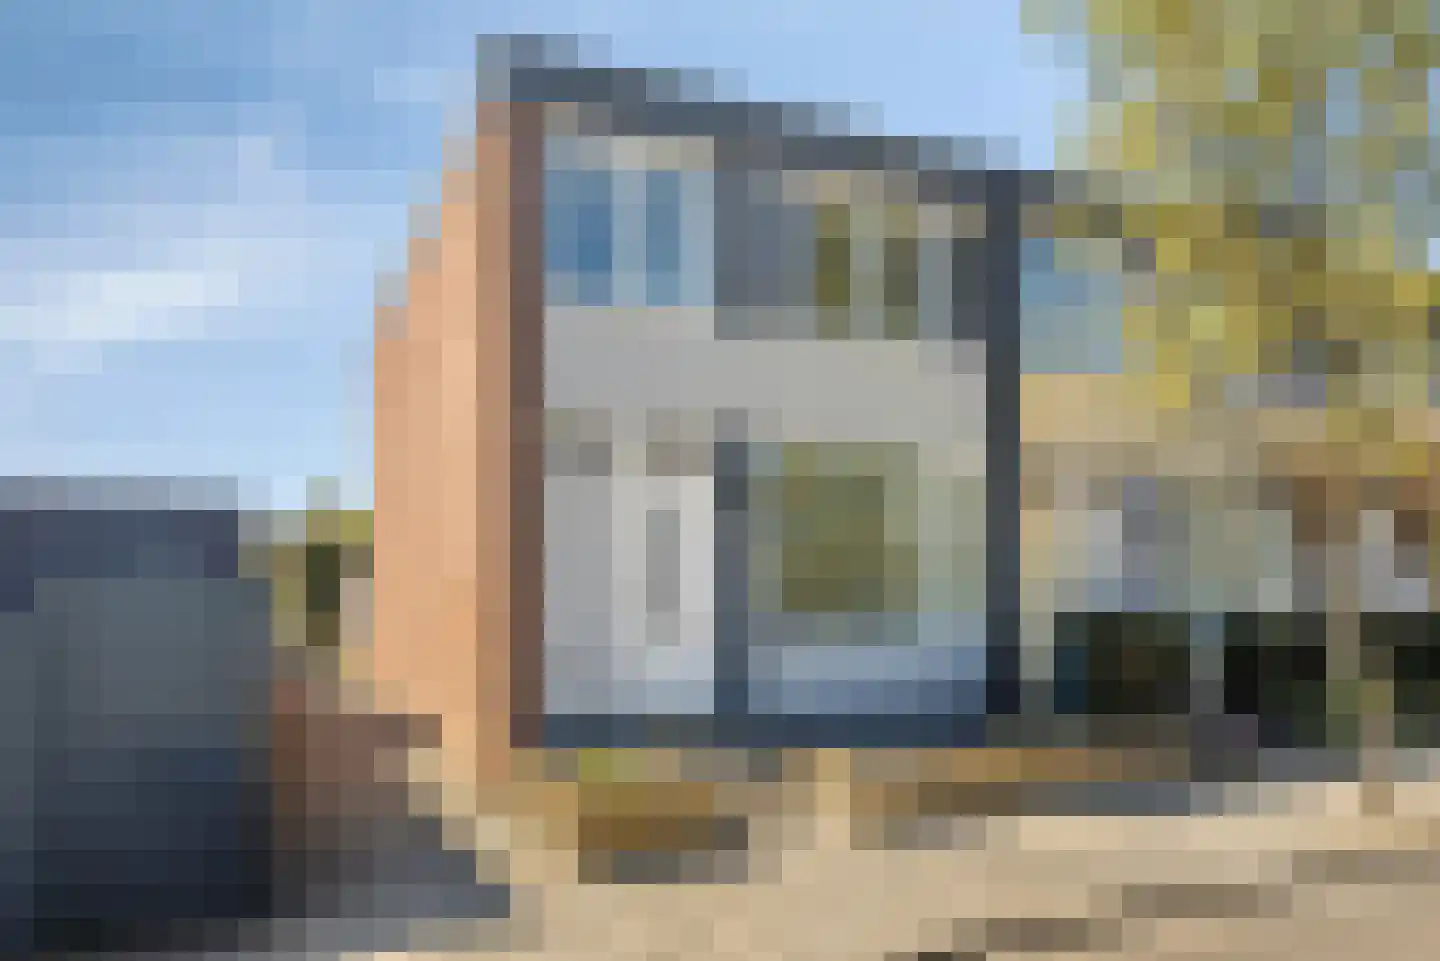
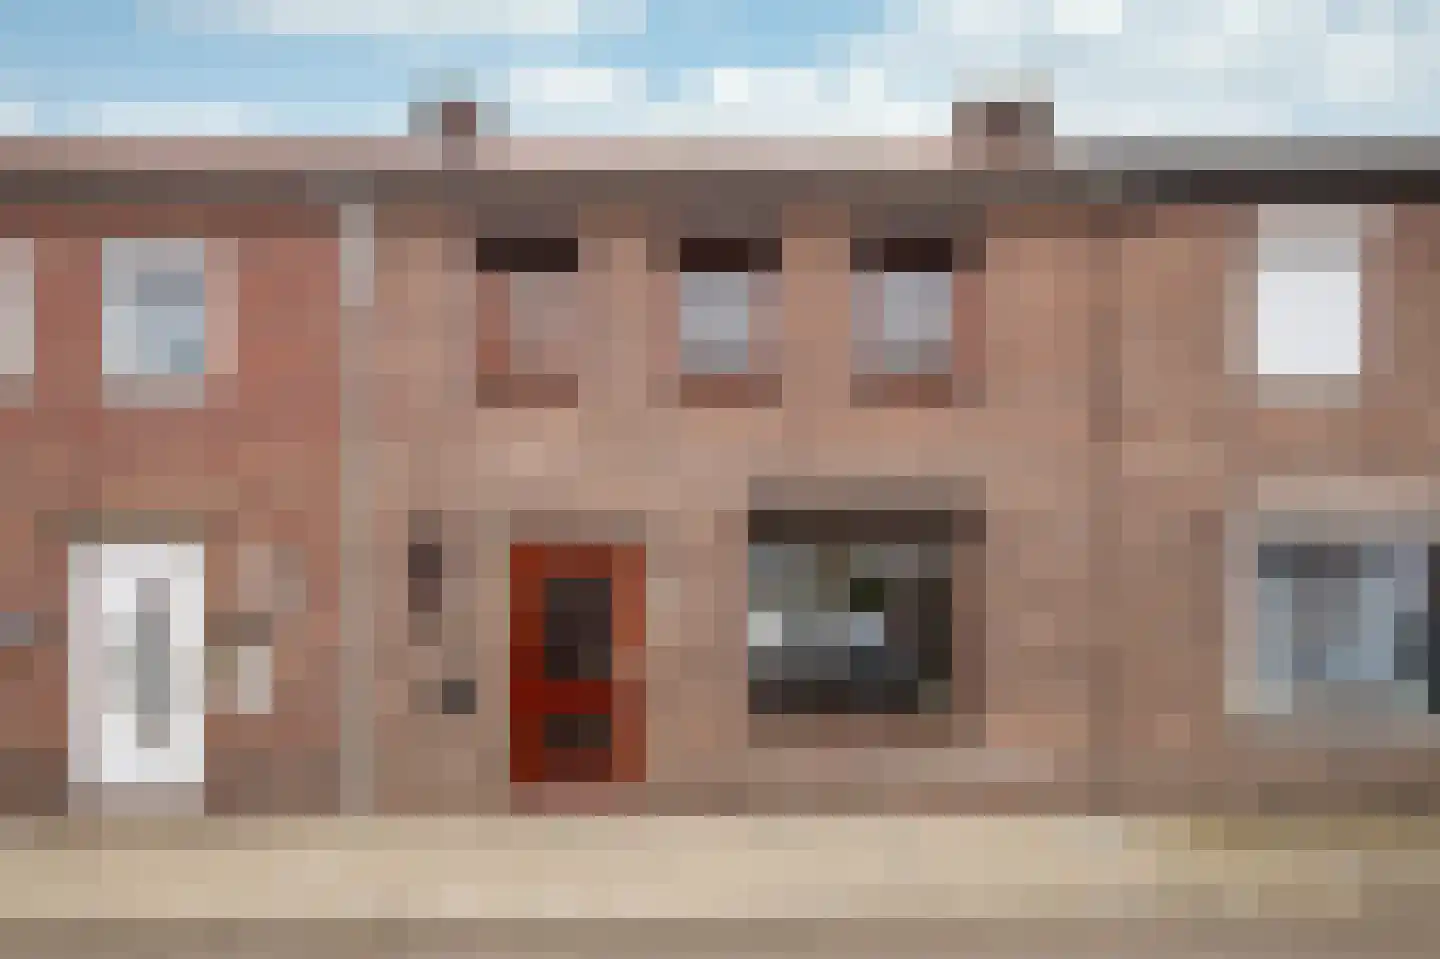
6471CR Eygelshoven • Limburg
€ 229.000 k.k.
Cost of copper (estimated): € 6.430
2% transfer tax (€ 4.580) + notary (€ 1.150) + valuation (€ 700)
Total incl. VAT: € 235.430
Purchase price /m²: € 2.140
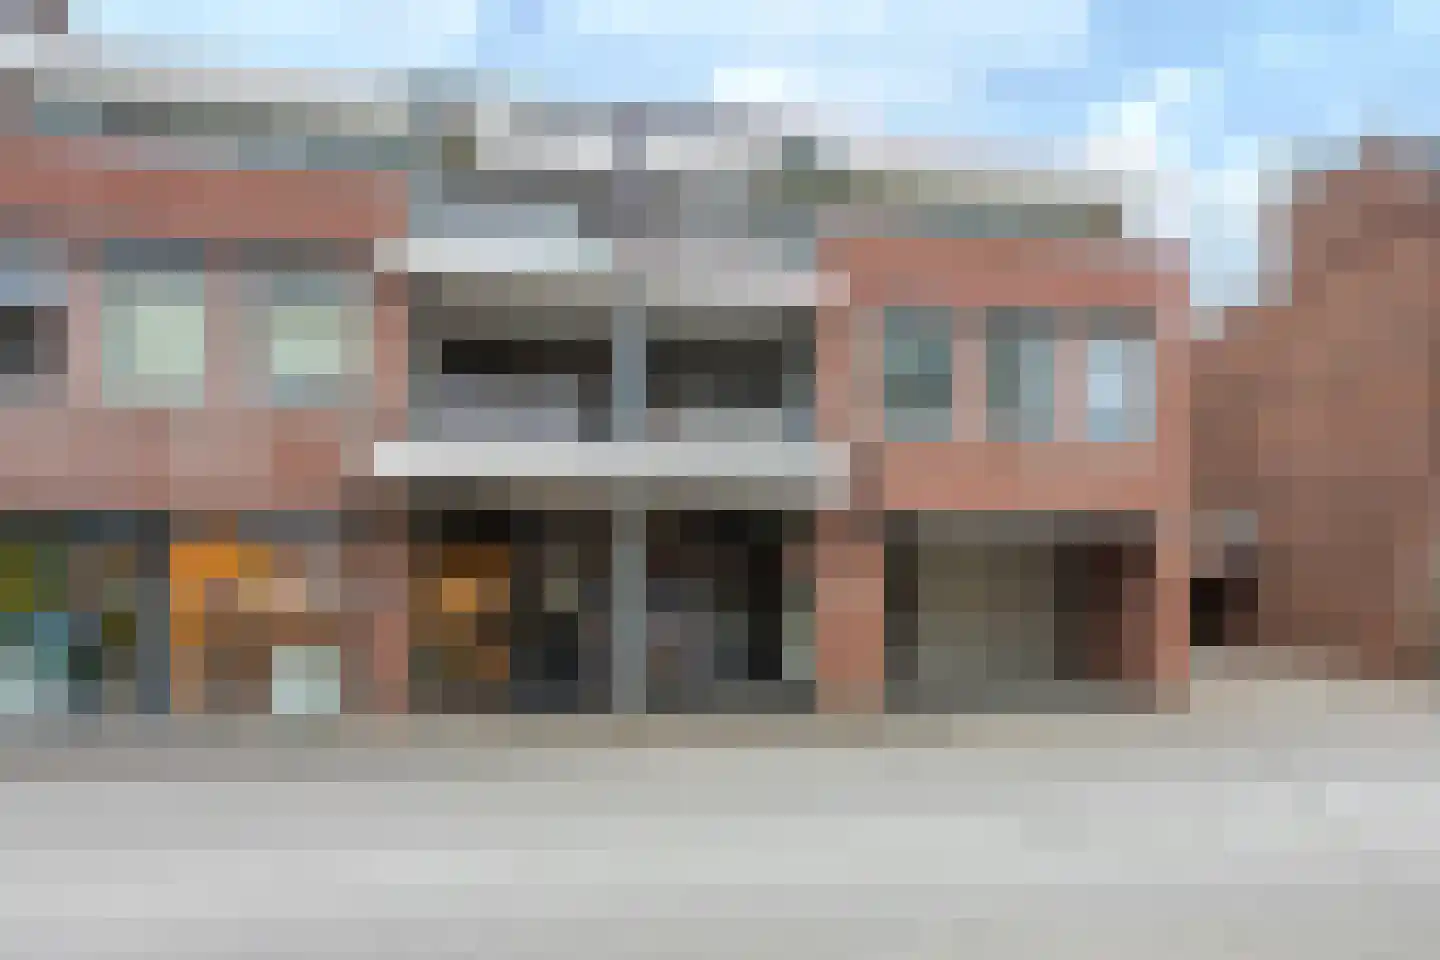
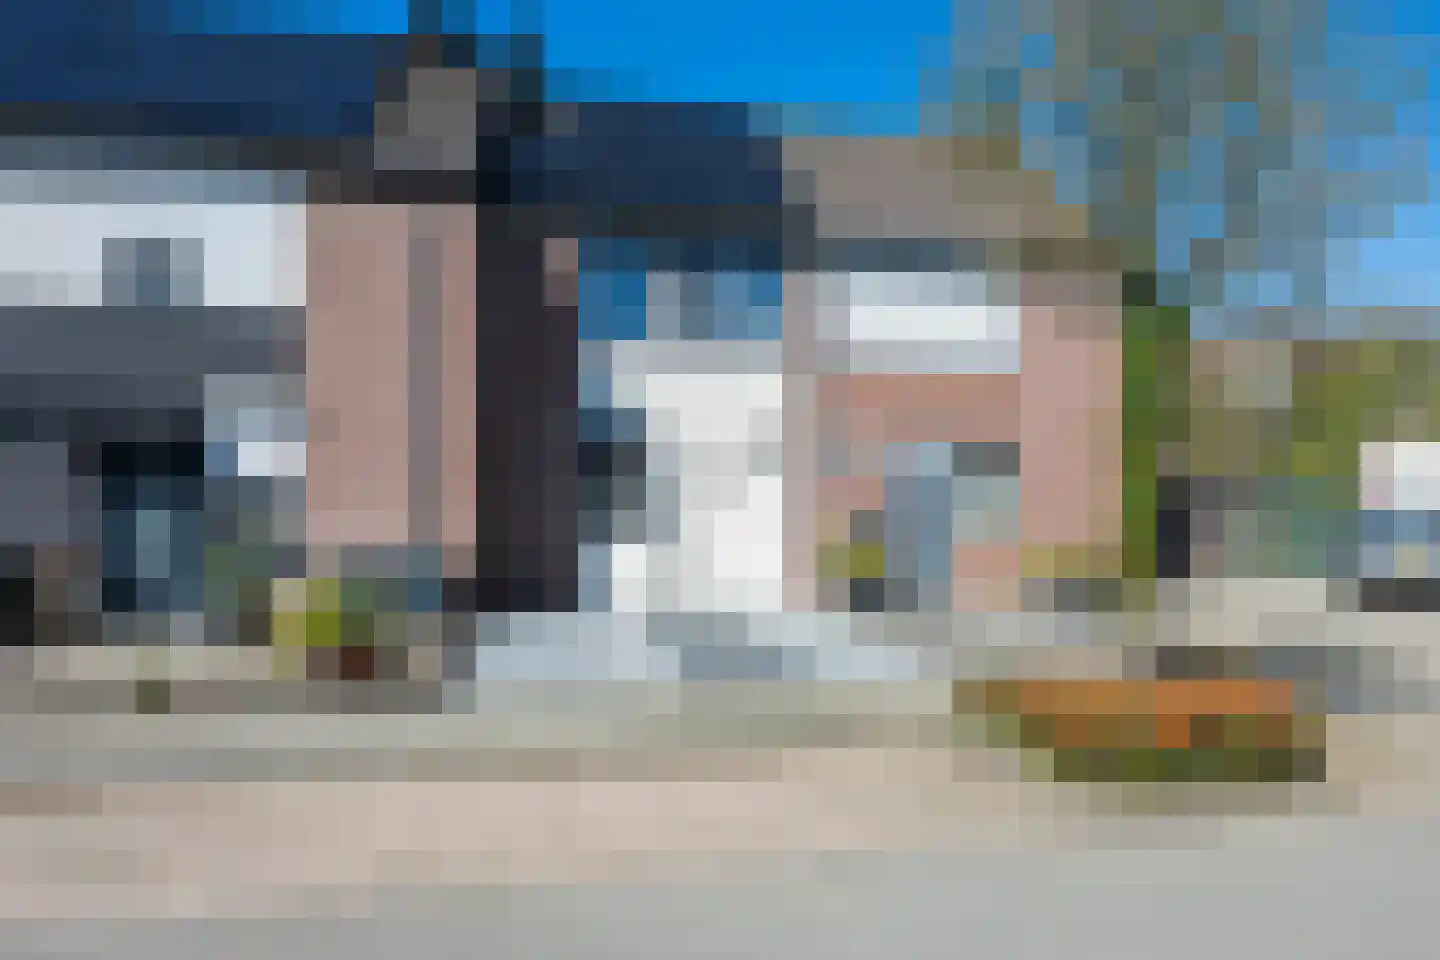
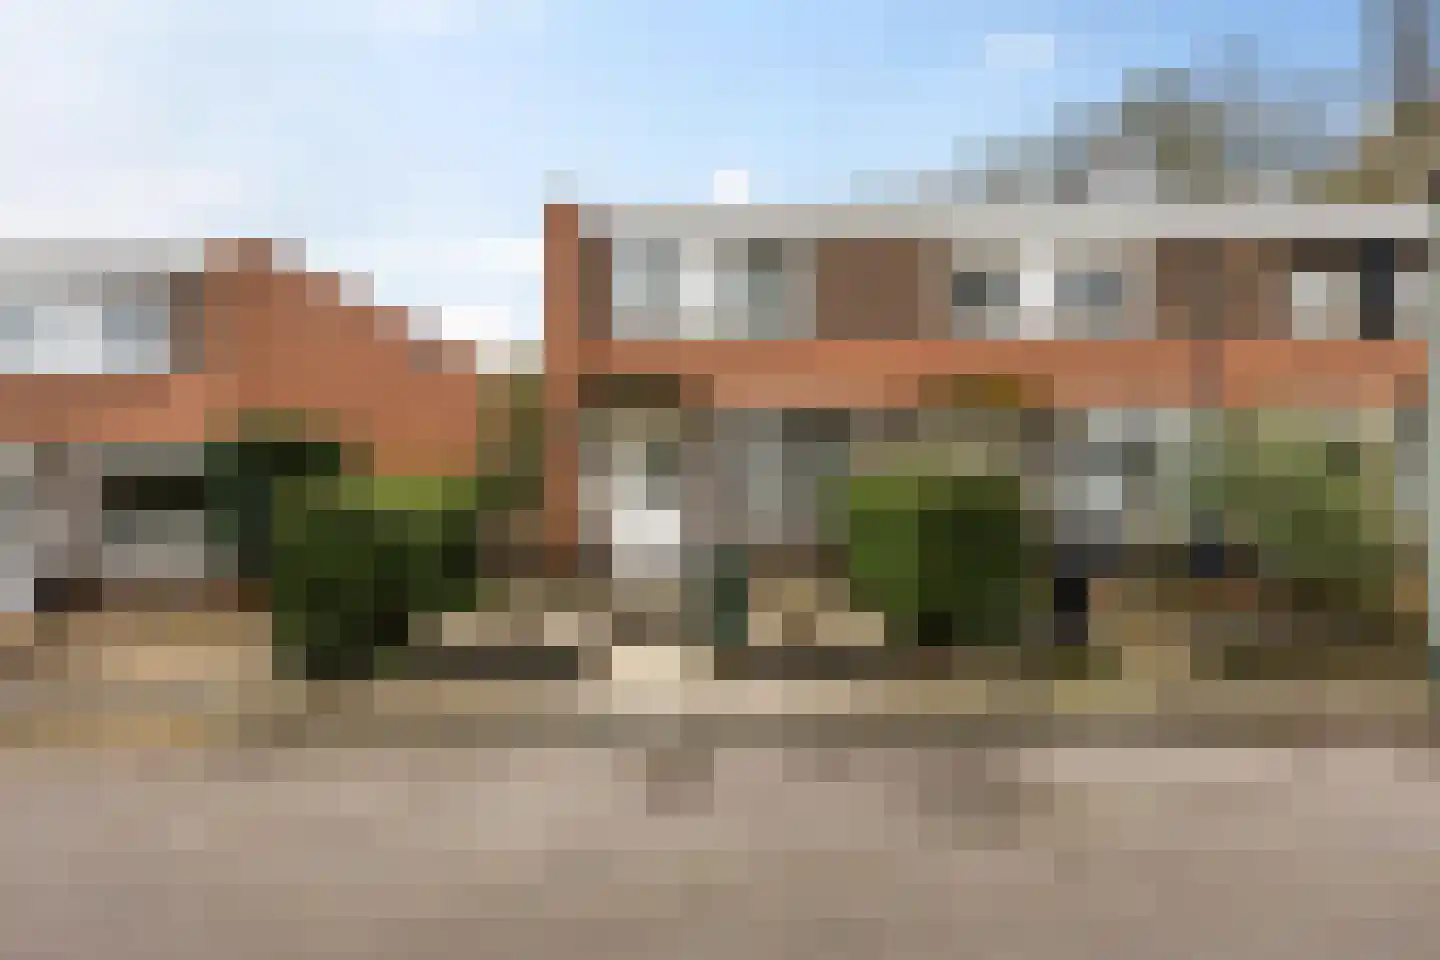
De woning aan Spoorstraat 3 in Eygelshoven is een eindwoning met een gebruiksoppervlakte van ongeveer 106 m2, gelegen op een perceel van 210 m2 met een ruime tuin. De woning is uit 2018 en heeft een energielabel C. Via de entree bereik je de hal met toilet, meterkast en trapopgang. De woonkamer is open verbonden met een moderne keuken met vernieuwd blad, gaskookplaat, koelkast, wasemkap en oven. Vanuit de keuken is toegang tot een bijkeuken met wasmachine aansluiting en CV-installatie van Intergas HR ECO. De achtertuin is voorzien van twee terrassen en een buitenberging. Op de eerste verdieping ligt een ruime overloop met bergkast, vier slaapkamers en een moderne badkamer met douche, designradiator, wastafel en tweede toilet. Aandachtspunten zijn de dubbelglazige kunststoffen kozijnen, het gasgekookte CV-systeem en de ideale ligging als starterswoning. De woning biedt dus een comfortabele en moderne woning in een rustige omgeving met groene ruimtes.
€ 229.000
Cost of copper (estimated): € 6.430
2% transfer tax (€ 4.580) + notary (€ 1.150) + valuation (€ 700)
Total purchase (incl. p.p.): € 235.430
2,78%
Yearly
€ 11.450
Direct available
Estimated mortgage
Indicative gross monthly cost
Based on annuity and 30 year term
Indicative net monthly cost
iDisclaimer: this mortgage calculation is a simplified indication based on general assumptions. No rights can be derived from the results shown. Calculated with 10-annual interest (met NHG), automatically determined based on the price limit € 470.000. Source: 10-jaars rente uit mortgage_rates (07-05-2026 03:45).
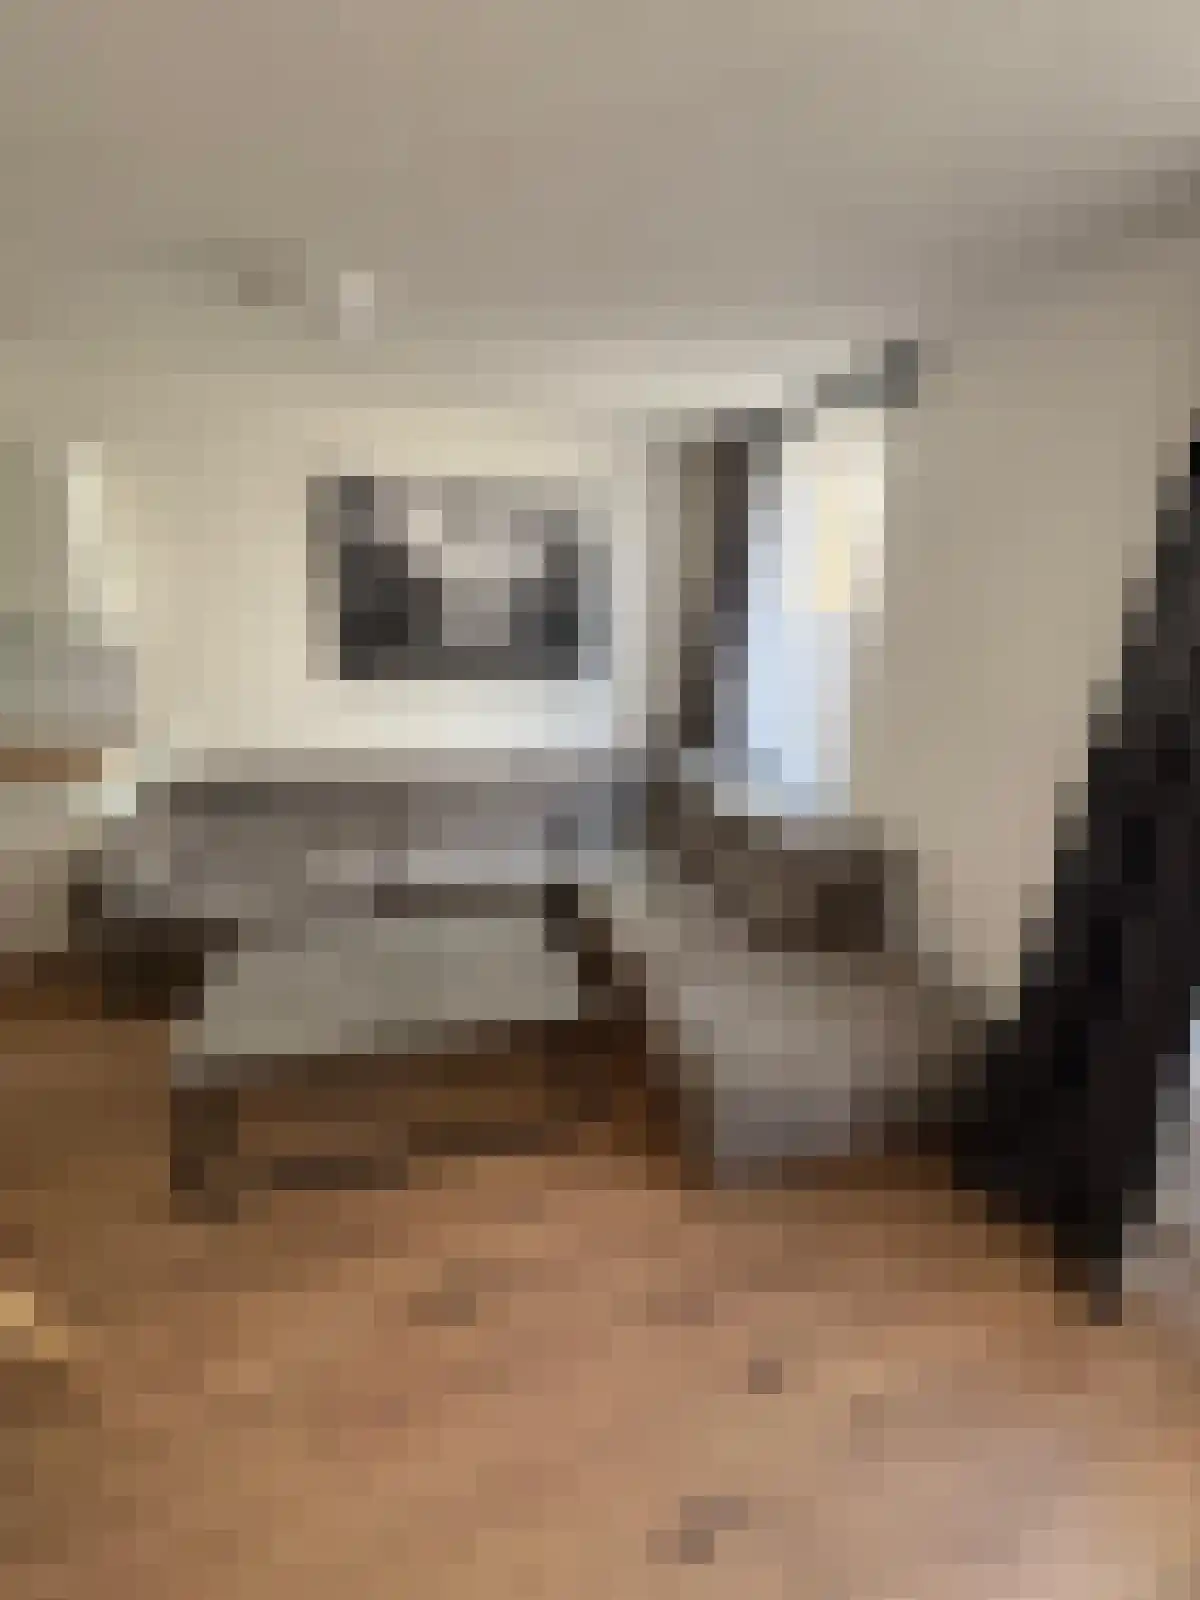
Douche, toilet, en wastafel
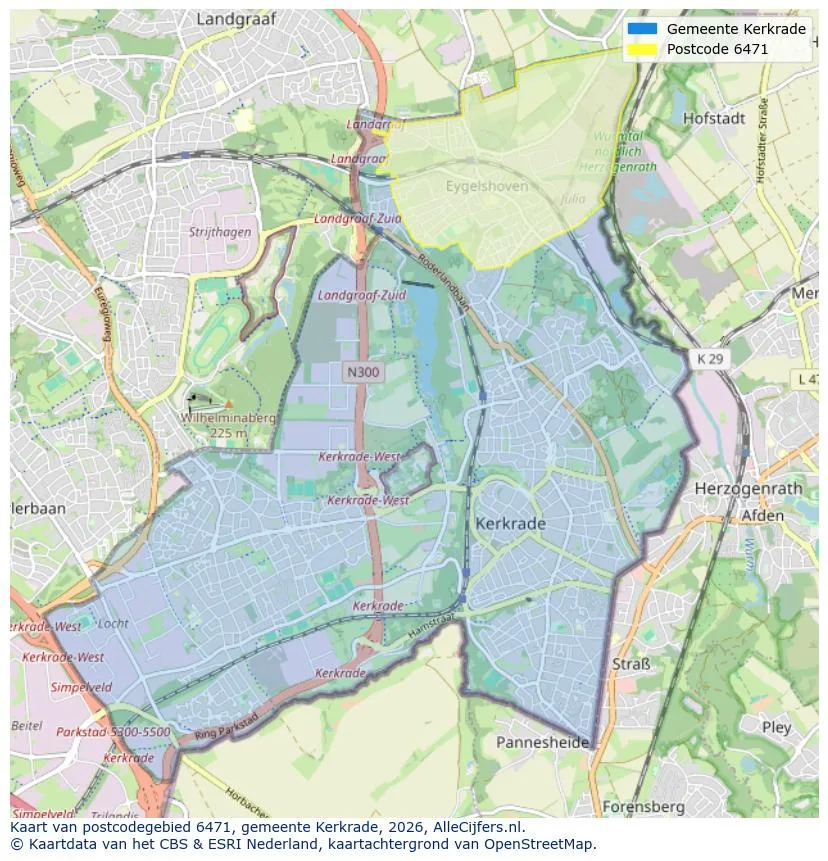
Explore Eygelshoven and the surrounding areas
View current location data on residents, WOZ development, housing stock, energy consumption, business activity and safety in Eygelshoven. In 2026 were there 5.772 residents. The average WOZ value in 2025 is EUR 229.283.
Residents
5.772
Last year: 2026
Average WOZ
EUR 229.283
Last year: 2025
Average income per person.
EUR 29.403
Source: AllNumbers
Crimes (current year)
270
Total registered
| Year | Residents |
|---|---|
| 2021 | 5.879 |
| 2022 | 5.806 |
| 2023 | 5.852 |
| 2024 | 5.775 |
| 2025 | 5.811 |
| 2026 | 5.772 |
| Year | Average WOZ |
|---|---|
| 2021 | EUR 174.809 |
| 2022 | EUR 184.322 |
| 2023 | EUR 215.923 |
| 2024 | EUR 216.664 |
| 2025 | EUR 229.283 |
Hoger
878
Praktisch
1.411
Middelbaar
2.093
Europa
1.226
Nederland
4.022
Buiten Europa
563
Label C
913
Label A
466
Label B
364
Label D
350
Label G
301
Label F
271
Label E
247
Label A+
113
Label A++
5
Label A+++
2
Label A++++
2
Label A+++++
0
| Year | Gas (m3) | Electricity (kWh) |
|---|---|---|
| 2020 | 1.245 | 2.776 |
| 2021 | 1.412 | 2.834 |
| 2022 | 1.105 | 2.717 |
| 2023 | 902 | 2.641 |
| 2024 | 871 | 2.744 |
Hoekwoning
Gas: 961 • Electricity: 2.825
Huurwoning
Gas: 769 • Electricity: 2.131
Koopwoning
Gas: 991 • Electricity: 2.969
Appartement
Gas: 728 • Electricity: 2.002
Tussenwoning
Gas: 858 • Electricity: 2.674
Vrijstaande woning
Gas: 1.288 • Electricity: 3.606
Twee-onder-één-kap woning
Gas: 1.072 • Electricity: 3.061
Total number of company establishments: 521
| Period | Crimes |
|---|---|
| jan 2026 | 16 |
| jul 2025 | 27 |
| jun 2025 | 33 |
| mei 2025 | 26 |
| mrt 2025 | 24 |
| mrt 2026 | 18 |
| nov 2024 | 25 |
| nov 2025 | 34 |
| okt 2024 | 19 |
| okt 2025 | 23 |
| sep 2024 | 21 |
| sep 2025 | 11 |
These figures give an indicative picture of safety trends in the living environment of Eygelshoven.
Short answers based on current local statistics, handy for a quick comparison of the living environment.
Eygelshoven telt in 2026 ongeveer 5.772 inwoners.
De gemiddelde WOZ-waarde in Eygelshoven is in 2025 circa € 229.283.
Het gemiddelde inkomen per inwoner in Eygelshoven ligt rond € 29.403 per jaar.
Voor het huidige jaar gaat het om ongeveer 270 geregistreerde misdrijven. Gebruik deze cijfers als indicatie en vergelijk trends per periode.
In Eygelshoven komt vooral "Tussenwoningen" veel voor, met ongeveer 893 woningen.
View more homes in this location.
6471JX Eygelshoven
Price upon request
6471JC Eygelshoven
€ 189.000 k.k.
€ 2.625/m²
6471CE Eygelshoven
€ 315.000 k.k.

6471EK Eygelshoven
€ 878 p/m
€ 12/m²

6471EK Eygelshoven
€ 160.000 k.k.
€ 2.162/m²

6471KD Eygelshoven
€ 269.000 k.k.
€ 3.092/m²
6471KB Eygelshoven
€ 265.000 k.k.
€ 2.325/m²
6471HP Eygelshoven
€ 229.000 k.k.
€ 2.267/m²
