
Residents
68.815
Last year: 2025
6411BR Heerlen • Limburg
€ 530 p/m
Rental price /m²: € 20
For this property, no detailed description is available yet.
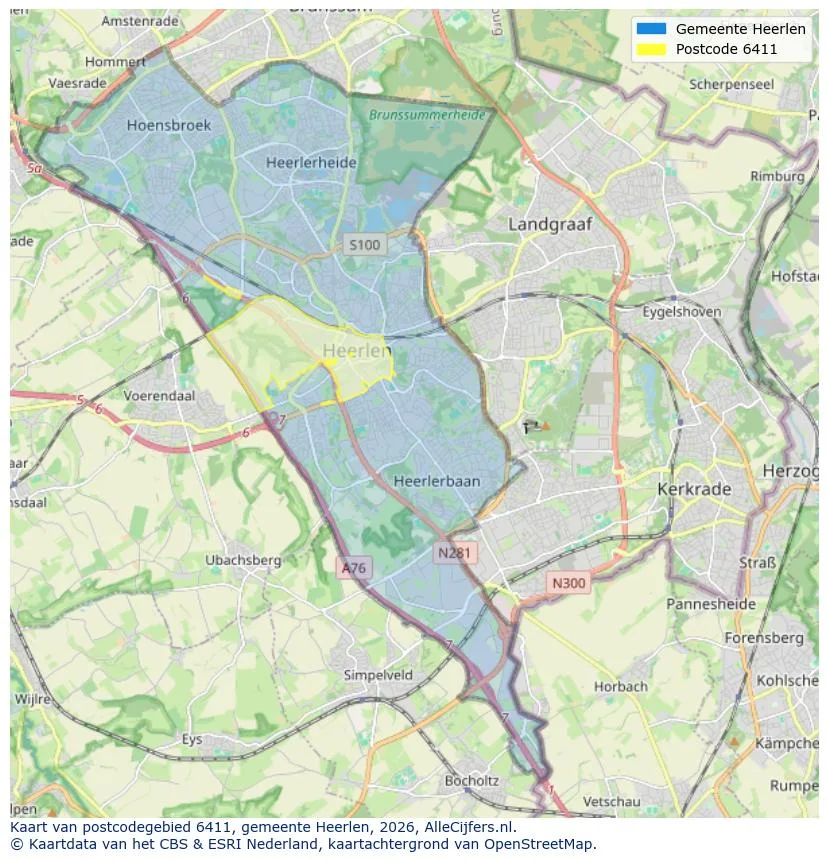
Geographic orientation and real estate agent density in Heerlen
View current location data on residents, WOZ development, housing stock, energy consumption, business activity and safety in Heerlen. In 2025 were there 68.815 residents. The average WOZ value in 2025 is EUR 218.029.
Residents
68.815
Last year: 2025
Average WOZ
EUR 218.029
Last year: 2025
Average income per person.
EUR 29.202
Source: AllNumbers
Crimes (current year)
4.829
Total registered
| Year | Residents |
|---|---|
| 2021 | 68.002 |
| 2022 | 67.963 |
| 2023 | 68.283 |
| 2024 | 68.638 |
| 2025 | 68.815 |
| Year | Average WOZ |
|---|---|
| 2021 | EUR 161.327 |
| 2022 | EUR 173.225 |
| 2023 | EUR 205.872 |
| 2024 | EUR 203.030 |
| 2025 | EUR 218.029 |
Hoger
12.893
Praktisch
16.908
Middelbaar
21.848
Europa
11.090
Nederland
45.575
Buiten Europa
12.160
Label C
10.659
Label A
5.993
Label B
5.625
Label D
4.213
Label E
3.598
Label F
3.468
Label G
3.286
Label A+
727
Label A++
255
Label A+++
178
Label A++++
55
Label A+++++
9
| Year | Gas (m3) | Electricity (kWh) |
|---|---|---|
| 2020 | 1.080 | 2.557 |
| 2021 | 1.218 | 2.591 |
| 2022 | 957 | 2.476 |
| 2023 | 810 | 2.376 |
| 2024 | 782 | 2.391 |
Hoekwoning
Gas: 1.013 • Electricity: 2.728
Huurwoning
Gas: 708 • Electricity: 2.003
Koopwoning
Gas: 908 • Electricity: 2.784
Appartement
Gas: 591 • Electricity: 1.777
Tussenwoning
Gas: 888 • Electricity: 2.552
Vrijstaande woning
Gas: 1.472 • Electricity: 3.817
Twee-onder-één-kap woning
Gas: 1.124 • Electricity: 2.986
Total number of company establishments: 7.095
| Period | Crimes |
|---|---|
| jan 2025 | 387 |
| jan 2026 | 341 |
| jul 2025 | 411 |
| jun 2025 | 429 |
| mei 2025 | 382 |
| mrt 2025 | 411 |
| nov 2024 | 419 |
| nov 2025 | 455 |
| okt 2024 | 452 |
| okt 2025 | 434 |
| sep 2024 | 422 |
| sep 2025 | 389 |
These figures give an indicative picture of safety trends in the living environment of Heerlen.
Short answers based on current local statistics, handy for a quick comparison of the living environment.
Heerlen telt in 2025 ongeveer 68.815 inwoners.
De gemiddelde WOZ-waarde in Heerlen is in 2025 circa € 218.029.
Het gemiddelde inkomen per inwoner in Heerlen ligt rond € 29.202 per jaar.
Voor het huidige jaar gaat het om ongeveer 4.829 geregistreerde misdrijven. Gebruik deze cijfers als indicatie en vergelijk trends per periode.
In Heerlen komt vooral "Appartementen" veel voor, met ongeveer 15.001 woningen.
View more homes in this location.

6411BR Heerlen
€ 410 p/m
€ 26/m²
6411BR Heerlen
€ 610 p/m
€ 20/m²
6417SR Heerlen
€ 540 p/m
€ 27/m²
6417SR Heerlen
€ 560 p/m
€ 24/m²
6417SR Heerlen
€ 460 p/m
€ 27/m²
6411BR Heerlen
€ 410 p/m
€ 24/m²
6418PM Heerlen
€ 700.000 k.k.
6413CK Heerlen
€ 215.000 k.k.
