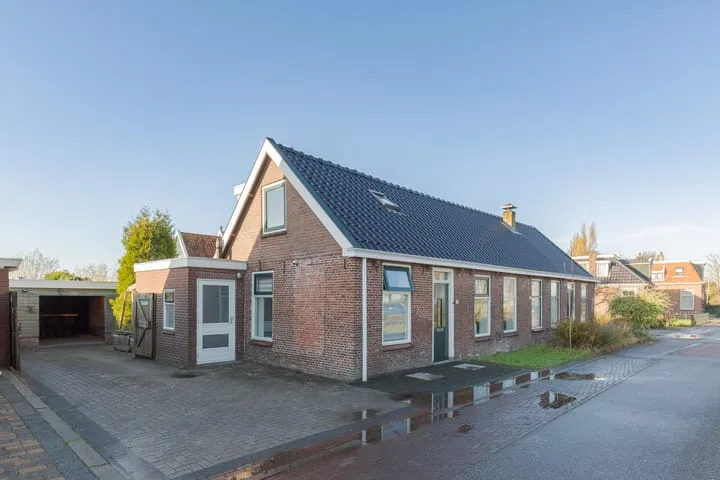
Houses sold in Hommerts

View 3 sold houses in Hommerts

Connected to: Vastgoed Nederland NVM Makelaars

On this page you will find recently sold homes in Hommerts. Use this overview to better estimate selling prices, popular neighborhoods, and the local housing supply before you choose a real estate agent. Also view the current housing supply with 3 houses in Hommerts.

Selection

Search and filter homes

Set your preferences and discover homes that suit you.

Total supply 242.874
Filters

Set price, area and other characteristics. Adjust a filter or click on Show homes. Location changes directly above.

Reset filters

You search for

  • Place Hommerts
  • Status Sold

Huis verkopen in Hommerts? Vergelijk verkoopmakelaars

Bekijk recente verkopen en ontvang gratis offertes van lokale makelaars. Vergelijk meer dan 26 makelaars in Hommerts.

Free request a quote

  • Quotes in Hommerts
  • Non-binding
  • Personal
  • Compare free rates

Zelf je woning verkopen in Hommerts? Vergelijk verkoopmakelaars in Hommerts of bekijk de beste verkoopmakelaars in Hommerts als referentie bij jouw keuze.

Vergelijk meerdere offertes

Makelaars maken scherpere voorstellen als ze weten dat je vergelijkt — vraag offertes aan voor verkoop of aankoop.

Frequently asked questions about sold homes in Hommerts

Short answers about housing prices, sold homes and comparing real estate agents in Hommerts.

Residential and neighborhood statistics in Hommerts

View current location data on residents, WOZ development, housing stock, energy consumption, business activity and safety in Hommerts. In 2025 were there 635 residents. The average WOZ value in 2025 is EUR 293.146.

These figures help to better assess and compare the housing stock in Hommerts with recent sold homes. Orient yourself then on suitable top real estate agents in Hommerts for sales advice in this region.

Residents

635

Last year: 2025

Average WOZ

EUR 293.146

Last year: 2025

Average income per person.

EUR 24.479

Source: AllNumbers

Crimes (current year)

8

Total registered

Demographics and WOZ development

Inhabitants per year

Inhabitants per year in Hommerts
Year Residents
2021 650
2022 640
2023 650
2024 625
2025 635

Annual WOZ value

WOZ value per year in Hommerts
Year Average WOZ
2021 EUR 223.004
2022 EUR 235.773
2023 EUR 272.261
2024 EUR 279.891
2025 EUR 293.146

Composition of residents

Age build-up

65+: 110 0-15: 105 15-25: 110 25-45: 120 45-65: 190

Education level

Hoger

100

Praktisch

100

Middelbaar

260

Origin of residents (2025)

Europa

30

Nederland

585

Buiten Europa

10

Housing stock and construction periods

Types of homes

Hoekwoningen 27
Appartementen 20
Tussenwoningen 25
Vrijstaande woningen 148
Twee-onder-één-kap woningen 48

Construction period of buildings

Voor 1700 0
1700 tot 1900 44
1900 tot 1925 42
1925 tot 1950 18
1950 tot 1970 48
1970 tot 1980 25
1980 tot 1990 40
1990 tot 2000 28
2000 tot 2010 18
2010 tot 2020 4
2020 en later 1

Energy and sustainability

Energy label distribution

Label G

71

Label C

53

Label B

43

Label A

36

Label D

23

Label F

21

Label E

17

Label A++

1

Label A+

0

Label A+++

0

Label A++++

0

Label A+++++

0

Average energy consumption per year

Average energy consumption per year in Hommerts
Year Gas (m3) Electricity (kWh)
2020 1.583 3.162
2021 1.863 3.400
2022 1.431 3.133
2023 1.169 3.067
2024 1.113 3.083

Consumption per house type

Hoekwoning

Gas: 908 • Electricity: 1.722

Huurwoning

Gas: 870 • Electricity: 1.927

Koopwoning

Gas: 1.213 • Electricity: 3.303

Appartement

Gas: 786 • Electricity: 2.105

Tussenwoning

Gas: 767 • Electricity: 1.955

Vrijstaande woning

Gas: 1.347 • Electricity: 3.507

Twee-onder-één-kap woning

Gas: 908 • Electricity: 2.554

Business activity in Hommerts (2025)

Handel en HORECA 10
Nijverheid en energie 25
Zakelijke dienstverlening 20
Overheid, onderwijs en zorg 15
Landbouw, bosbouw en visserij 10
Vervoer, informatie en communicatie 5
Financiele diensten en onroerendgoed 0
Cultuur, recreatie en overige diensten 10

Total number of company establishments: 110

Recent crime statistics

Recent crime statistics in Hommerts
Period Crimes
jan 2025 0
jan 2026 2
jul 2025 1
jun 2025 0
mei 2025 0
mrt 2025 2
nov 2024 3
nov 2025 0
okt 2024 0
okt 2025 1
sep 2024 0
sep 2025 0

These figures give an indicative picture of safety trends in the living environment of Hommerts.

Frequently asked questions about living in Hommerts

Short answers based on current local statistics, handy for a quick comparison of the living environment.

Hoeveel inwoners heeft Hommerts?

Hommerts telt in 2025 ongeveer 635 inwoners.

Wat is de gemiddelde WOZ-waarde in Hommerts?

De gemiddelde WOZ-waarde in Hommerts is in 2025 circa € 293.146.

Wat is het gemiddelde inkomen per inwoner in Hommerts?

Het gemiddelde inkomen per inwoner in Hommerts ligt rond € 24.479 per jaar.

Hoe veilig is wonen in Hommerts?

Voor het huidige jaar gaat het om ongeveer 8 geregistreerde misdrijven. Gebruik deze cijfers als indicatie en vergelijk trends per periode.

Welke woningtypen komen het meest voor in Hommerts?

In Hommerts komt vooral "Vrijstaande woningen" veel voor, met ongeveer 148 woningen.

Receive free, non-binding quotes

Compare multiple real estate agents and choose the best match.