
Residents
2.230
Last year: 2025
4493RM Kamperland • Zeeland
€ 449.000 k.k.
Cost of copper (estimated): € 10.830
2% transfer tax (€ 8.980) + notary (€ 1.150) + valuation (€ 700)
Total incl. VAT: € 459.830
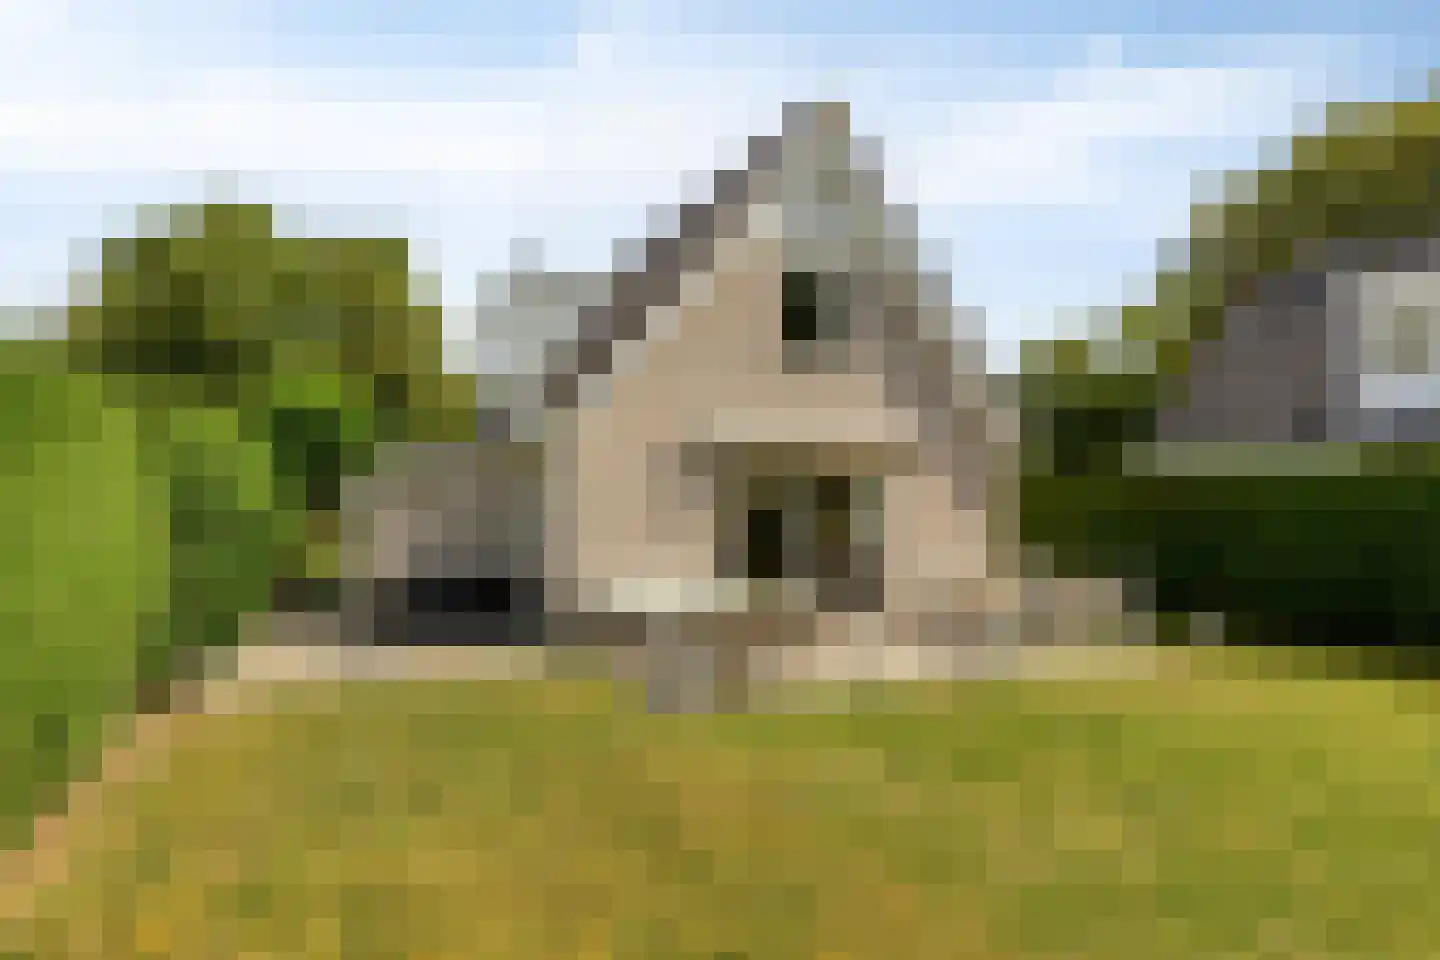
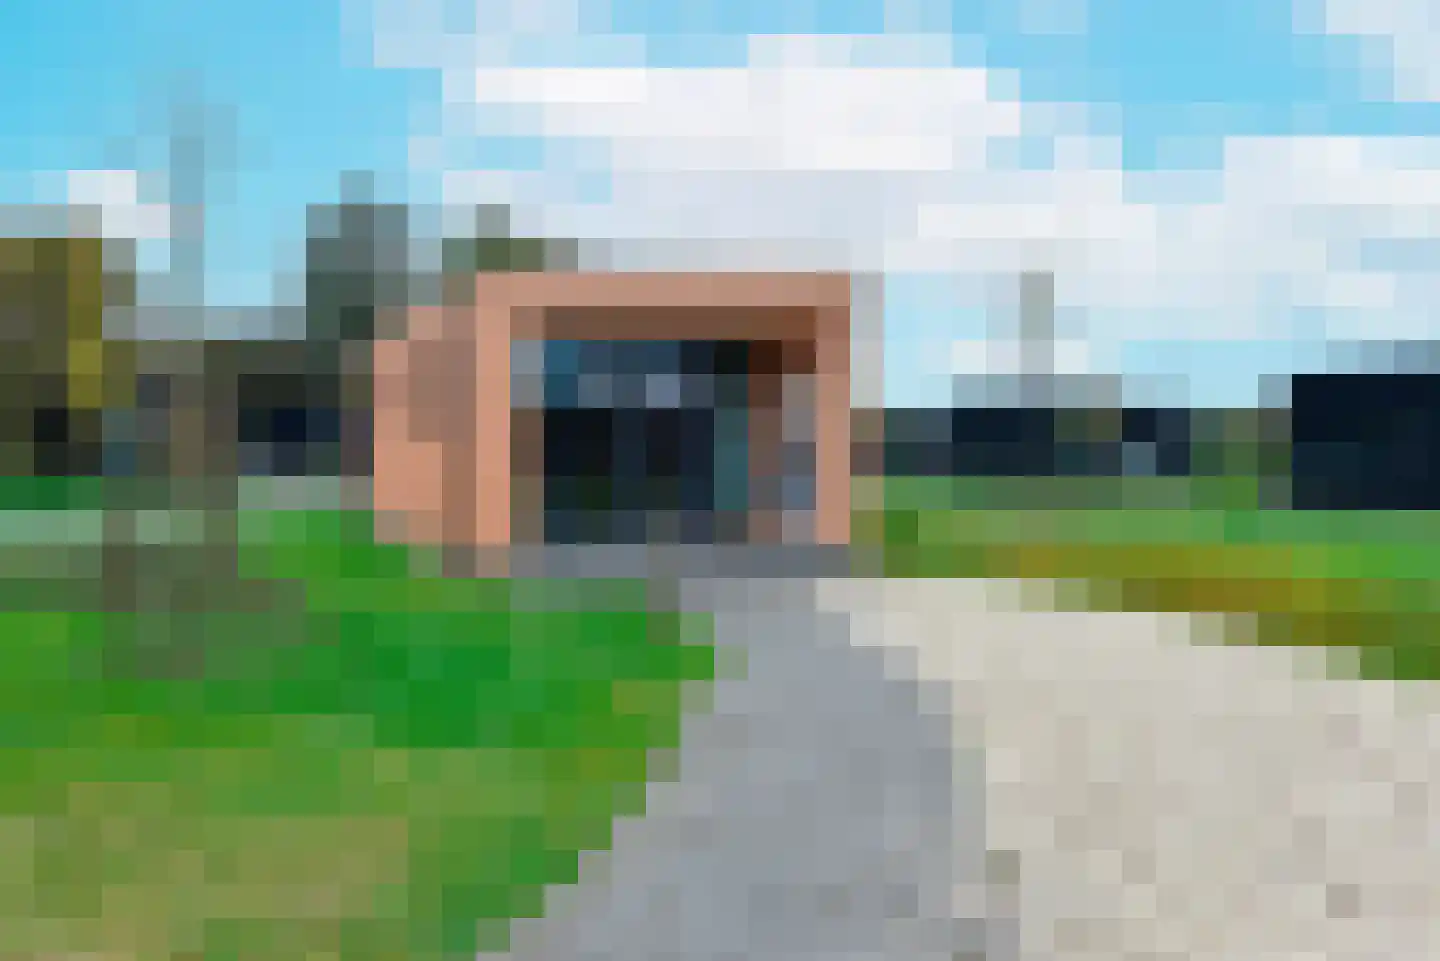
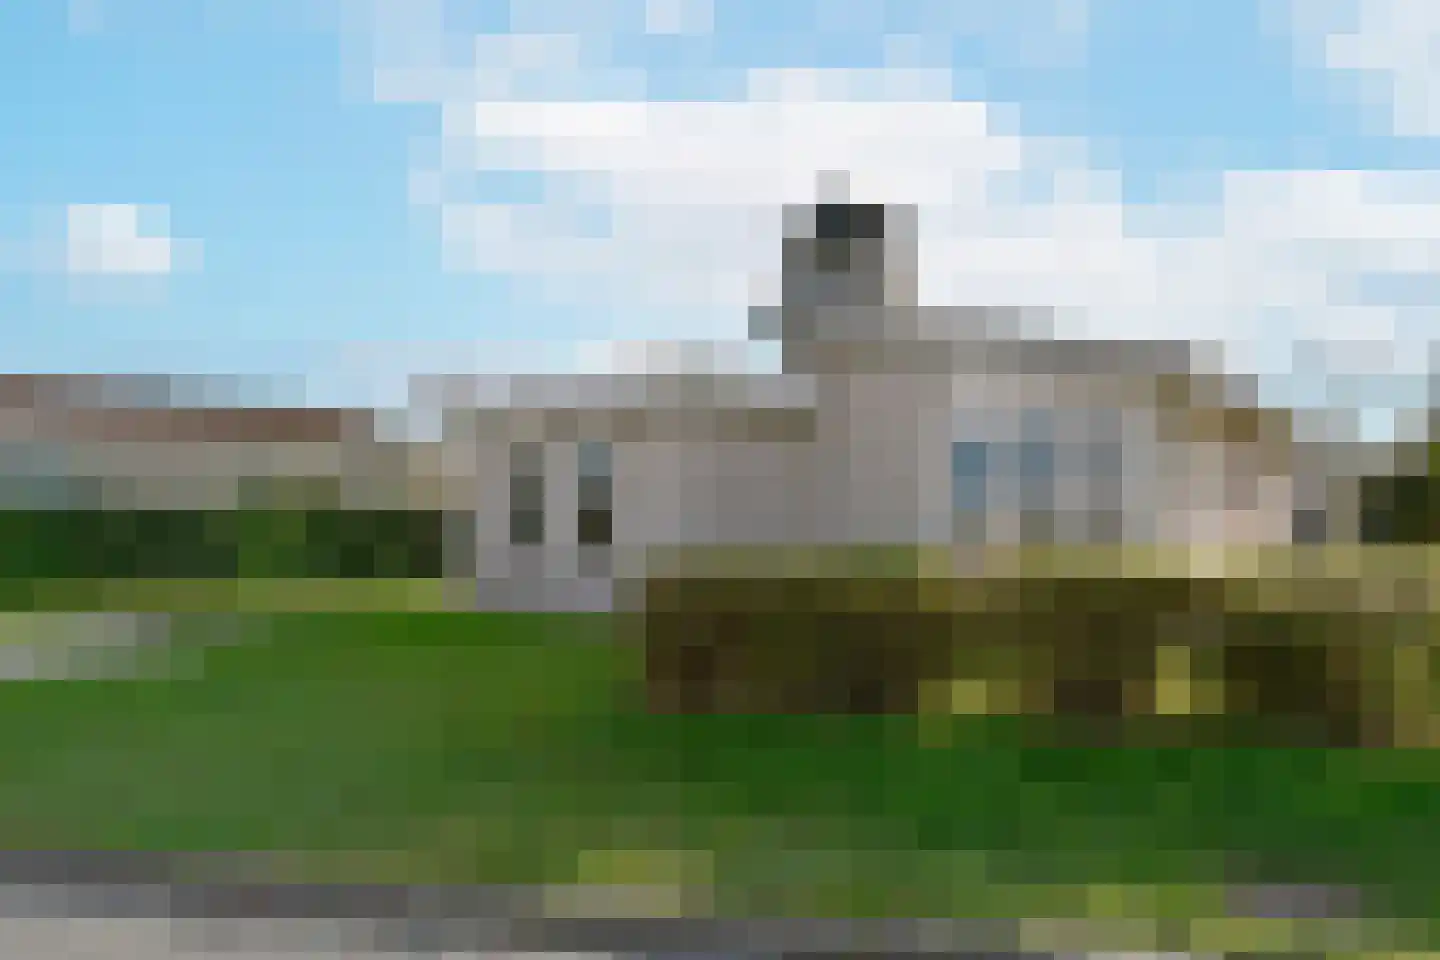
Sfeervolle twee-onder-een-kap vakantiewoning met sauna, direct onderaan de duinen! Op een unieke locatie in Residence De Banjaard in Kamperland ligt deze comfortabele twee-onder-een-kap vakantiewoning. Gelegen als de op één na laatste woning onderaan de duin, wandel je vanuit de woning zo richting het uitgestrekte Noordzeestrand. Hier ervaar je optimaal het vrije Zeeuwse kustgevoel, met rust, ruimte en natuur binnen handbereik. De woning bevindt zich op een verzorgd en groen opgezet park met diverse voorzieningen. In de directe omgeving vind je het gezellige Kamperland en dankzij de goede verbindingen zijn steden als Goes, Middelburg en Zierikzee eenvoudig bereikbaar. De combinatie van strand, duinen en voorzieningen maakt deze locatie bijzonder geliefd voor eigen gebruik en recreatieve verhuur. Indeling Begane grond: Via de entree kom je binnen in de hal met trapopgang en toegang tot een separaat toilet. Vanuit de hal bereik je de lichte woonkamer, gelegen aan de tuinzijde en voorzien van grote raampartijen en openslaande deuren naar buiten. De open keuken met inbouwapparatuur sluit direct aan op de woonkamer. Op de begane grond is tevens een slaapkamer met badkamer aanwezig, ideaal voor levensloopbestendig gebruik. De badkamer is ingericht met ligbad en wastafel. Vanuit de hal is tevens de inpandige berging bereikbaar. Eerste verdieping: De overloop biedt toegang tot drie ruime en lichte slaapkamers. Op deze verdieping bevindt zich een tweede badkamer, voorzien van douche, wastafel en toilet. Daarnaast is er een sauna in de badkamer aanwezig, wat zorgt voor extra comfort en ontspanning. Tuin: De woning beschikt over een ruime voor-, zij- en achtertuin, waardoor je op elk moment van de dag een fijne plek in de zon of schaduw kunt vinden. Aan de voorzijde is er ruimte om te parkeren op eigen terrein. De achtertuin biedt volop privacy en is voorzien van een vrijstaande houten berging, ideaal voor het opbergen van fietsen en tuinmateriaal. Algemeen: Twee-onder-een-kap vakantiewoning Unieke ligging: één na laatste woning onderaan de duin Op loopafstand van het Noordzeestrand Woonoppervlakte ca. 118 m² Energielabel B Vier slaapkamers Twee badkamers Sauna aanwezig Inpandige berging Laadpaal aanwezig Goede verhuurmogelijkheden Inclusief inventaris Nabij voorzieningen en goede bereikbaarheid richting Goes, Middelburg en Zierikzee Deze informatie is door Ruiterplaat Makelaardij met de grootst mogelijke zorgvuldigheid samengesteld. Desondanks kunnen aan de inhoud geen rechten worden ontleend. Alle opgegeven maten en oppervlakten zijn indicatief. Voor gebruiks- en bestemmingsmogelijkheden dient u zich te laten informeren bij de daarvoor bevoegde instanties. Ruiterplaat Makelaardij aanvaardt geen aansprakelijkheid voor eventuele onjuistheden of onvolledigheden. ### Gemütliche Doppelhaushälfte mit Sauna, direkt am Fuße der Dünen! In einzigartiger Lage in der Residence De Banjaard in Kamperland befindet sich dieses komfortable Doppelhaus. Als vorletztes Haus am Fuße der Düne gelegen, spazieren Sie von der Unterkunft aus direkt zum weitläufigen Nordseestrand. Hier erleben Sie das freie Küstengefühl Zeelands in vollen Zügen, mit Ruhe, Weite und Natur in unmittelbarer Nähe. Das Haus befindet sich in einem gepflegten und grün angelegten Park mit verschiedenen Einrichtungen. In der unmittelbaren Umgebung finden Sie das gemütliche Kamperland, und dank der guten Verkehrsanbindung sind Städte wie Goes, Middelburg und Zierikzee leicht zu erreichen. Die Kombination aus Strand, Dünen und Einrichtungen macht diesen Standort besonders beliebt für den Eigengebrauch und die Freizeitvermietung. Aufteilung Erdgeschoss: Über den Eingangsbereich gelangen Sie in den Flur mit Treppenaufgang und Zugang zu einer separaten Toilette. Vom Flur aus erreichen Sie das helle Wohnzimmer, das zur Gartenseite liegt und mit großen Fenstern sowie Flügeltüren nach draußen ausgestattet ist. Die offene Küche mit Einbaugeräten schließt direkt an das Wohnzimmer an. Im Erdgeschoss befindet sich außerdem ein Schlafzimmer mit Bad, ideal für altersgerechtes Wohnen. Das Badezimmer ist mit Badewanne und Waschbecken ausgestattet. Vom Flur aus ist auch der Abstellraum im Haus erreichbar. Erster Stock: Der Flur bietet Zugang zu drei geräumigen und hellen Schlafzimmern. Auf dieser Etage befindet sich ein zweites Badezimmer, ausgestattet mit Dusche Erster Stock: Der Flur bietet Zugang zu drei geräumigen und hellen Schlafzimmern. Auf dieser Etage befindet sich ein zweites Badezimmer, ausgestattet mit Dusche, Waschbecken und Toilette. Darüber hinaus verfügt das Badezimmer über eine Sauna, die für zusätzlichen Komfort und Entspannung sorgt. Garten: Das Haus verfügt über einen großzügigen Vorder-, Seiten- und Hintergarten, sodass Sie zu jeder Tageszeit einen schönen Platz in der Sonne oder im Schatten finden können. An der Vorderseite gibt es Platz zum Parken auf dem eigenen Grundstück. Der Hintergarten bietet viel Privatsphäre und verfügt über einen freistehenden Holzschuppen, ideal zur Aufbewahrung von Fahrrädern und Gartengeräten. Allgemeines: Doppelhaushälfte Einzigartige Lage: vorletzte Wohnung am Fuße der Düne Nur wenige Gehminuten vom Nordseestrand entfernt Wohnfläche ca. 118 m² Energieeffizienzklasse B Vier Schlafzimmer Zwei Badezimmer Sauna vorhanden Abstellraum im Haus Ladestation vorhanden Gute Vermietungsmöglichkeiten Inklusive Inventar In der Nähe von Annehmlichkeiten und gute Erreichbarkeit in Richtung Goes, Middelburg und Zierikzee Diese Informationen wurden von Ruiterplaat Makelaardij mit größtmöglicher Sorgfalt zusammengestellt. Dennoch können aus dem Inhalt keine Rechte abgeleitet werden. Alle angegebenen Maße und Flächenangaben sind Richtwerte. Bezüglich der Nutzungs- und Bestimmungsmöglichkeiten sollten Sie sich bei den zuständigen Behörden informieren. Ruiterplaat Makelaardij übernimmt keine Haftung für eventuelle Ungenauigkeiten oder Unvollständigkeiten.
€ 449.000
Cost of copper (estimated): € 10.830
2% transfer tax (€ 8.980) + notary (€ 1.150) + valuation (€ 700)
Total purchase (incl. p.p.): € 459.830
3,07%
Yearly
€ 22.450
Direct available
Estimated mortgage
Indicative gross monthly cost
Based on annuity and 30 year term
Indicative net monthly cost
iDisclaimer: this mortgage calculation is a simplified indication based on general assumptions. No rights can be derived from the results shown. Calculated with 10-annual interest (met NHG), automatically determined based on the price limit € 470.000. Source: 10-jaars rente uit mortgage_rates (12-06-2026 03:45).
Sauna, ligbad, 2 wastafels, 2 wastafelmeubels, douche, en toilet
Geographic orientation and real estate agent density in Kamperland
View current location data on residents, WOZ development, housing stock, energy consumption, business activity and safety in Kamperland. In 2025 were there 2.230 residents. The average WOZ value in 2025 is EUR 411.000.
Residents
2.230
Last year: 2025
Average WOZ
EUR 411.000
Last year: 2025
Average income per person.
EUR 33.200
Source: AllNumbers
Crimes (current year)
90
Total registered
| Year | Residents |
|---|---|
| 2021 | 2.100 |
| 2022 | 2.085 |
| 2023 | 2.180 |
| 2024 | 2.195 |
| 2025 | 2.230 |
| Year | Average WOZ |
|---|---|
| 2021 | EUR 305.000 |
| 2022 | EUR 335.000 |
| 2023 | EUR 382.000 |
| 2024 | EUR 389.000 |
| 2025 | EUR 411.000 |
Hoger
430
Praktisch
350
Middelbaar
840
Europa
240
Nederland
1.870
Buiten Europa
115
Label C
851
Label B
631
Label A
620
Label G
277
Label D
202
Label F
113
Label A+
86
Label E
60
Label A+++
53
Label A++
23
Label A++++
20
Label A+++++
1
| Year | Gas (m3) | Electricity (kWh) |
|---|---|---|
| 2020 | 1.180 | 2.430 |
| 2021 | 1.350 | 2.650 |
| 2022 | 1.040 | 2.520 |
| 2023 | 860 | 2.460 |
| 2024 | 850 | 2.570 |
Hoekwoning
Gas: 720 • Electricity: 1.940
Huurwoning
Gas: 750 • Electricity: 2.030
Koopwoning
Gas: 910 • Electricity: 2.640
Appartement
Gas: 590 • Electricity: 2.050
Tussenwoning
Gas: 660 • Electricity: 1.890
Vrijstaande woning
Gas: 980 • Electricity: 2.790
Twee-onder-één-kap woning
Gas: 870 • Electricity: 2.420
Total number of company establishments: 430
| Period | Crimes |
|---|---|
| jan 2026 | 4 |
| jul 2025 | 11 |
| jun 2025 | 10 |
| mei 2025 | 7 |
| mrt 2025 | 5 |
| mrt 2026 | 2 |
| nov 2024 | 6 |
| nov 2025 | 5 |
| okt 2024 | 4 |
| okt 2025 | 4 |
| sep 2024 | 6 |
| sep 2025 | 9 |
These figures give an indicative picture of safety trends in the living environment of Kamperland.
Short answers based on current local statistics, handy for a quick comparison of the living environment.
Kamperland telt in 2025 ongeveer 2.230 inwoners.
De gemiddelde WOZ-waarde in Kamperland is in 2025 circa € 411.000.
Het gemiddelde inkomen per inwoner in Kamperland ligt rond € 33.200 per jaar.
Voor het huidige jaar gaat het om ongeveer 90 geregistreerde misdrijven. Gebruik deze cijfers als indicatie en vergelijk trends per periode.
In Kamperland komt vooral "Vrijstaande woningen" veel voor, met ongeveer 793 woningen.
View more homes in this location.
4493AL Kamperland
€ 399.000 k.k.
€ 3.912/m²
4493RA Kamperland
€ 589.000 k.k.
4493RW Kamperland
€ 825.000 k.k.
4493RE Kamperland
€ 635.000 k.k.

4493EM Kamperland
€ 925.000 k.k.
€ 5.745/m²

4493EM Kamperland
€ 925.000 k.k.
4493ST Kamperland
€ 272.500 k.k.
4493PL Kamperland
€ 485.000 k.k.
