Residents
92.305
Last year: 2025
8911AK Leeuwarden • Fryslân
€ 775 p/m
Rental price /m²: € 16
For this property, no detailed description is available yet.
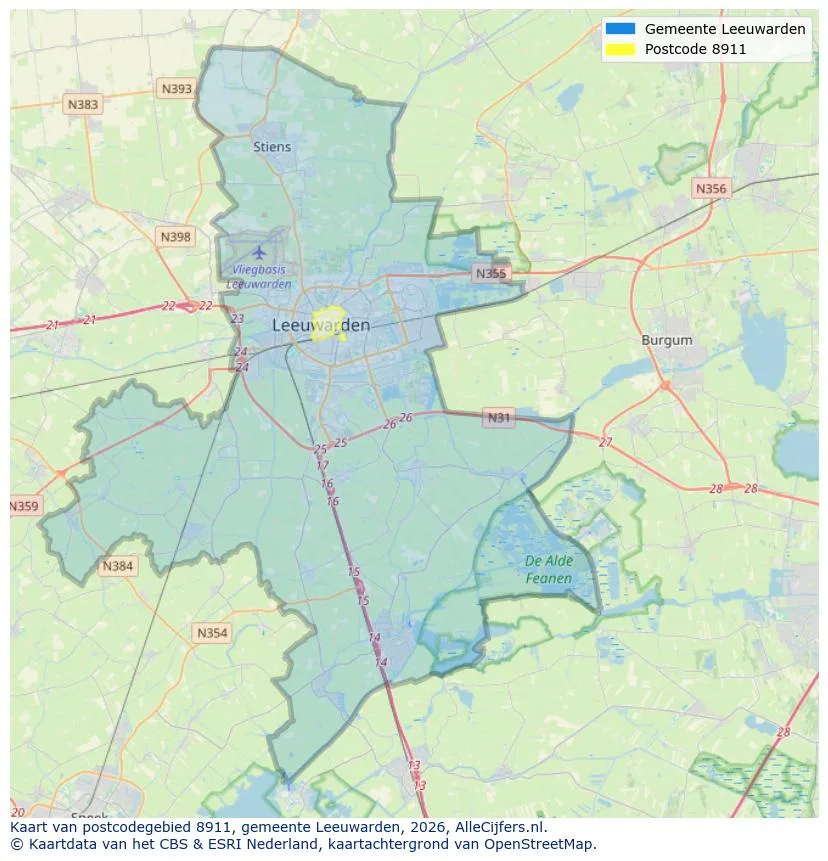
Geographic orientation and real estate agent density in Leeuwarden
View current location data on residents, WOZ development, housing stock, energy consumption, business activity and safety in Leeuwarden. In 2025 were there 92.305 residents. The average WOZ value in 2025 is EUR 231.856.
Residents
92.305
Last year: 2025
Average WOZ
EUR 231.856
Last year: 2025
Average income per person.
EUR 29.253
Source: AllNumbers
Crimes (current year)
6.497
Total registered
| Year | Residents |
|---|---|
| 2021 | 87.170 |
| 2022 | 88.035 |
| 2023 | 89.220 |
| 2024 | 91.125 |
| 2025 | 92.305 |
| Year | Average WOZ |
|---|---|
| 2021 | EUR 159.463 |
| 2022 | EUR 178.137 |
| 2023 | EUR 206.426 |
| 2024 | EUR 219.395 |
| 2025 | EUR 231.856 |
Hoger
22.610
Praktisch
17.660
Middelbaar
31.550
Europa
7.600
Nederland
67.760
Buiten Europa
16.935
Label A
13.887
Label C
12.288
Label B
6.802
Label F
4.296
Label D
3.948
Label G
3.635
Label E
3.488
Label A+
1.262
Label A+++
1.174
Label A++
583
Label A++++
149
Label A+++++
8
| Year | Gas (m3) | Electricity (kWh) |
|---|---|---|
| 2020 | 1.015 | 2.132 |
| 2021 | 1.125 | 2.180 |
| 2022 | 864 | 2.065 |
| 2023 | 746 | 1.971 |
| 2024 | 729 | 2.005 |
Hoekwoning
Gas: 968 • Electricity: 2.331
Huurwoning
Gas: 637 • Electricity: 1.708
Koopwoning
Gas: 899 • Electricity: 2.302
Appartement
Gas: 539 • Electricity: 1.578
Tussenwoning
Gas: 858 • Electricity: 2.187
Vrijstaande woning
Gas: 1.345 • Electricity: 3.057
Twee-onder-één-kap woning
Gas: 1.091 • Electricity: 2.563
Total number of company establishments: 11.435
| Period | Crimes |
|---|---|
| jan 2025 | 507 |
| jan 2026 | 444 |
| jul 2025 | 528 |
| jun 2025 | 554 |
| mei 2025 | 550 |
| mrt 2025 | 540 |
| nov 2024 | 484 |
| nov 2025 | 518 |
| okt 2024 | 554 |
| okt 2025 | 618 |
| sep 2024 | 542 |
| sep 2025 | 573 |
These figures give an indicative picture of safety trends in the living environment of Leeuwarden.
Short answers based on current local statistics, handy for a quick comparison of the living environment.
Leeuwarden telt in 2025 ongeveer 92.305 inwoners.
De gemiddelde WOZ-waarde in Leeuwarden is in 2025 circa € 231.856.
Het gemiddelde inkomen per inwoner in Leeuwarden ligt rond € 29.253 per jaar.
Voor het huidige jaar gaat het om ongeveer 6.497 geregistreerde misdrijven. Gebruik deze cijfers als indicatie en vergelijk trends per periode.
In Leeuwarden komt vooral "Appartementen" veel voor, met ongeveer 24.726 woningen.
View more homes in this location.

8914AE Leeuwarden
€ 595 p/m
€ 30/m²
8922AS Leeuwarden
€ 275.000 k.k.
8939AX Leeuwarden
€ 575.000 k.k.
8939CM Leeuwarden
€ 595.000 k.k.
8932PJ Leeuwarden
€ 530 p/m
€ 29/m²
8941CR Leeuwarden
€ 525.000 k.k.
8912DE Leeuwarden
€ 464.950 v.o.n.
8912DE Leeuwarden
€ 459.950 v.o.n.
