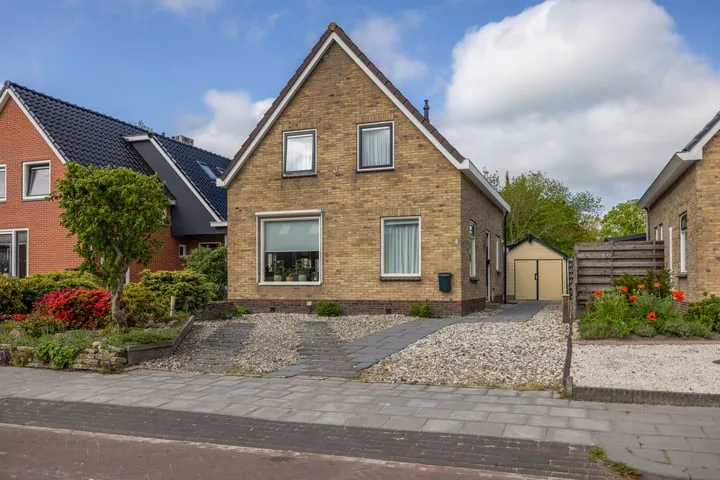
Houses sold in Lutjegast

View 2 sold houses in Lutjegast

Connected to: Vastgoed Nederland NVM Makelaars

On this page you will find recently sold homes in Lutjegast. Use this overview to better estimate selling prices, popular neighborhoods, and the local housing supply before you choose a real estate agent. Also view the current housing supply with 4 houses in Lutjegast.

Selection

Search and filter homes

Set your preferences and discover homes that suit you.

Total supply 242.022
Filters

Set price, area and other characteristics. Adjust a filter or click on Show homes. Location changes directly above.

Reset filters

You search for

  • Place Lutjegast
  • Status Sold

Huis verkopen in Lutjegast? Vergelijk verkoopmakelaars

Bekijk recente verkopen en ontvang gratis offertes van lokale makelaars. Vergelijk meer dan 21 makelaars in Lutjegast.

Free request a quote

  • Quotes in Lutjegast
  • Non-binding
  • Personal
  • Compare free rates

Zelf je woning verkopen in Lutjegast? Vergelijk verkoopmakelaars in Lutjegast of bekijk de beste verkoopmakelaars in Lutjegast als referentie bij jouw keuze.

Vergelijk meerdere offertes

Makelaars maken scherpere voorstellen als ze weten dat je vergelijkt — vraag offertes aan voor verkoop of aankoop.

Frequently asked questions about sold homes in Lutjegast

Short answers about housing prices, sold homes and comparing real estate agents in Lutjegast.

Residential and neighborhood statistics in Lutjegast

View current location data on residents, WOZ development, housing stock, energy consumption, business activity and safety in Lutjegast. In 2025 were there 932 residents. The average WOZ value in 2025 is EUR 338.442.

These figures help to better assess and compare the housing stock in Lutjegast with recent sold homes. Orient yourself then on suitable top real estate agents in Lutjegast for sales advice in this region.

Residents

932

Last year: 2025

Average WOZ

EUR 338.442

Last year: 2025

Average income per person.

EUR 27.829

Source: AllNumbers

Crimes (current year)

11

Total registered

Demographics and WOZ development

Inhabitants per year

Inhabitants per year in Lutjegast
Year Residents
2021 932
2022 935
2023 914
2024 929
2025 932

Annual WOZ value

WOZ value per year in Lutjegast
Year Average WOZ
2021 EUR 228.716
2022 EUR 267.205
2023 EUR 317.516
2024 EUR 314.903
2025 EUR 338.442

Composition of residents

Age build-up

65+: 150 0-15: 182 15-25: 117 25-45: 222 45-65: 263

Education level

Hoger

137

Praktisch

169

Middelbaar

396

Origin of residents (2025)

Europa

13

Nederland

899

Buiten Europa

18

Housing stock and construction periods

Types of homes

Hoekwoningen 32
Appartementen 2
Tussenwoningen 30
Vrijstaande woningen 270
Twee-onder-één-kap woningen 30

Construction period of buildings

Voor 1700 0
1700 tot 1900 13
1900 tot 1925 79
1925 tot 1950 63
1950 tot 1970 79
1970 tot 1980 51
1980 tot 1990 32
1990 tot 2000 30
2000 tot 2010 26
2010 tot 2020 3
2020 en later 10

Energy and sustainability

Energy label distribution

Label G

105

Label C

74

Label D

61

Label A

38

Label B

38

Label F

32

Label E

12

Label A+++

7

Label A+

0

Label A++

0

Label A++++

0

Label A+++++

0

Average energy consumption per year

Average energy consumption per year in Lutjegast
Year Gas (m3) Electricity (kWh)
2020 1.770 3.491
2021 1.988 3.469
2022 1.568 3.240
2023 1.271 3.108
2024 1.235 3.180

Consumption per house type

Hoekwoning

Gas: 711 • Electricity: 1.618

Huurwoning

Gas: 1.198 • Electricity: 2.224

Koopwoning

Gas: 1.287 • Electricity: 3.273

Tussenwoning

Gas: 742 • Electricity: 1.407

Vrijstaande woning

Gas: 1.351 • Electricity: 3.342

Twee-onder-één-kap woning

Gas: 1.168 • Electricity: 3.053

Business activity in Lutjegast (2025)

Handel en HORECA 15
Nijverheid en energie 25
Zakelijke dienstverlening 23
Overheid, onderwijs en zorg 18
Landbouw, bosbouw en visserij 31
Vervoer, informatie en communicatie 5
Financiele diensten en onroerendgoed 8
Cultuur, recreatie en overige diensten 13

Total number of company establishments: 135

Recent crime statistics

Recent crime statistics in Lutjegast
Period Crimes
jan 2025 2
jan 2026 0
jul 2025 3
jun 2025 0
mei 2025 3
mrt 2025 1
nov 2024 0
nov 2025 0
okt 2024 0
okt 2025 0
sep 2024 1
sep 2025 1

These figures give an indicative picture of safety trends in the living environment of Lutjegast.

Frequently asked questions about living in Lutjegast

Short answers based on current local statistics, handy for a quick comparison of the living environment.

Hoeveel inwoners heeft Lutjegast?

Lutjegast telt in 2025 ongeveer 932 inwoners.

Wat is de gemiddelde WOZ-waarde in Lutjegast?

De gemiddelde WOZ-waarde in Lutjegast is in 2025 circa € 338.442.

Wat is het gemiddelde inkomen per inwoner in Lutjegast?

Het gemiddelde inkomen per inwoner in Lutjegast ligt rond € 27.829 per jaar.

Hoe veilig is wonen in Lutjegast?

Voor het huidige jaar gaat het om ongeveer 11 geregistreerde misdrijven. Gebruik deze cijfers als indicatie en vergelijk trends per periode.

Welke woningtypen komen het meest voor in Lutjegast?

In Lutjegast komt vooral "Vrijstaande woningen" veel voor, met ongeveer 270 woningen.

Receive free, non-binding quotes

Compare multiple real estate agents and choose the best match.