- Sold
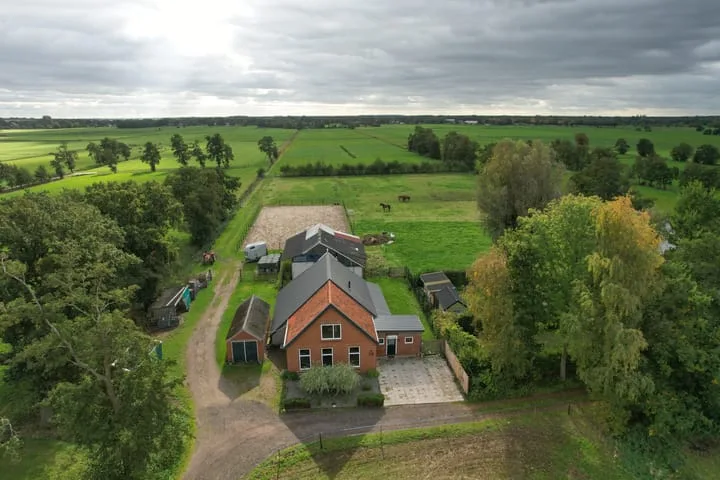
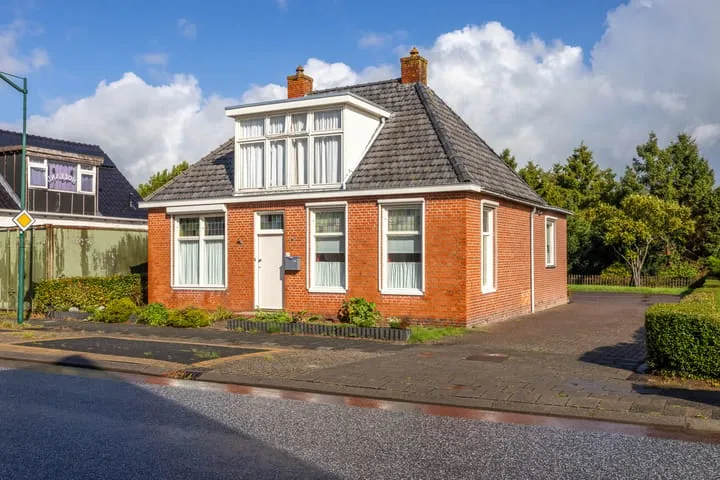
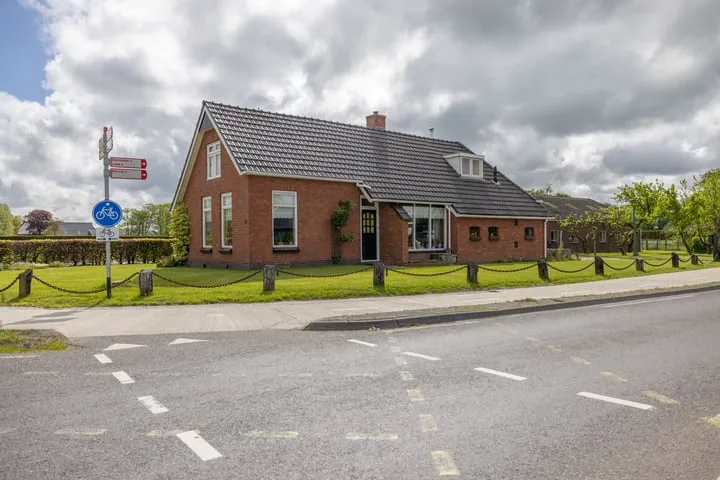
Meidoornlaan 21
9821PK Oldekerk
€ 350.000 k.k.
€ 2.364/m²
C
Save as favorite
- Living area
- 148 m²
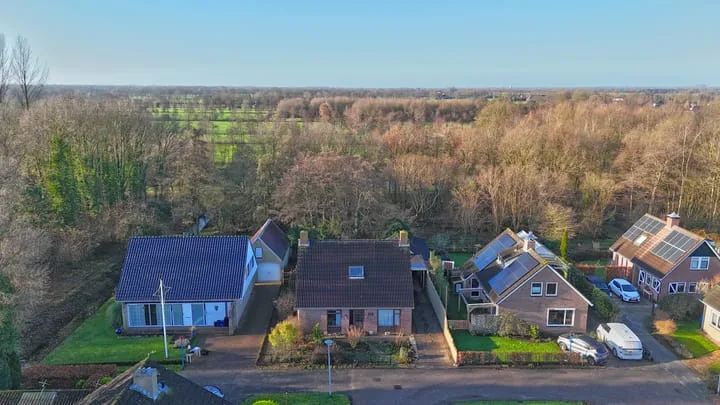
- Land area
- 486 m²
- Bedrooms
- 4