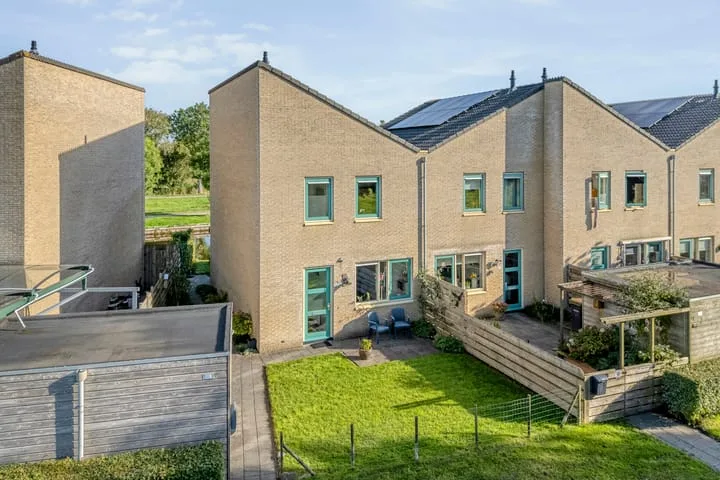
Houses sold in Oldemarkt

View 26 sold houses in Oldemarkt

Connected to: Vastgoed Nederland NVM Makelaars

On this page you will find recently sold homes in Oldemarkt. Use this overview to better estimate selling prices, popular neighborhoods, and the local housing supply before you choose a real estate agent. Also view the current housing supply with 38 houses in Oldemarkt.

Selection

Search and filter homes

Set your preferences and discover homes that suit you.

Total supply 242.722
Filters

Set price, area and other characteristics. Adjust a filter or click on Show homes. Location changes directly above.

Reset filters

You search for

  • Place Oldemarkt
  • Status Sold

Huis verkopen in Oldemarkt? Vergelijk verkoopmakelaars

Bekijk recente verkopen en ontvang gratis offertes van lokale makelaars. Vergelijk meer dan 18 makelaars in Oldemarkt.

Free request a quote

  • Quotes in Oldemarkt
  • Non-binding
  • Personal
  • Gratis tarieven vergelijken

Zelf je woning verkopen in Oldemarkt? Vergelijk verkoopmakelaars in Oldemarkt of bekijk de beste verkoopmakelaars in Oldemarkt als referentie bij jouw keuze.

Vergelijk meerdere offertes

Makelaars maken scherpere voorstellen als ze weten dat je vergelijkt — vraag offertes aan voor verkoop of aankoop.

Frequently asked questions about sold homes in Oldemarkt

Short answers about housing prices, sold homes and comparing real estate agents in Oldemarkt.

Residential and neighborhood statistics in Oldemarkt

View current location data on residents, WOZ development, housing stock, energy consumption, business activity and safety in Oldemarkt. In 2025 were there 2.705 residents. The average WOZ value in 2025 is EUR 323.000.

These figures help to better assess and compare the housing stock in Oldemarkt with recent sold homes. Orient yourself then on suitable top real estate agents in Oldemarkt for sales advice in this region.

Residents

2.705

Last year: 2025

Average WOZ

EUR 323.000

Last year: 2025

Average income per person.

EUR 31.500

Source: AllNumbers

Crimes (current year)

40

Total registered

Demographics and WOZ development

Inhabitants per year

Inhabitants per year in Oldemarkt
Year Residents
2021 2.545
2022 2.585
2023 2.610
2024 2.705
2025 2.705

Annual WOZ value

WOZ value per year in Oldemarkt
Year Average WOZ
2021 EUR 230.000
2022 EUR 252.000
2023 EUR 296.000
2024 EUR 309.000
2025 EUR 323.000

Composition of residents

Age build-up

65+: 720 0-15: 380 15-25: 275 25-45: 595 45-65: 730

Education level

Hoger

540

Praktisch

460

Middelbaar

1.030

Origin of residents (2025)

Europa

175

Nederland

2.460

Buiten Europa

65

Housing stock and construction periods

Types of homes

Hoekwoningen 166
Appartementen 93
Tussenwoningen 220
Vrijstaande woningen 517
Twee-onder-één-kap woningen 219

Construction period of buildings

Voor 1700 2
1700 tot 1900 53
1900 tot 1925 87
1925 tot 1950 81
1950 tot 1970 171
1970 tot 1980 234
1980 tot 1990 148
1990 tot 2000 222
2000 tot 2010 133
2010 tot 2020 49
2020 en later 60

Energy and sustainability

Energy label distribution

Label C

300

Label B

258

Label A

243

Label G

120

Label D

108

Label F

82

Label E

42

Label A+++

20

Label A+

6

Label A++

6

Label A++++

3

Label A+++++

0

Average energy consumption per year

Average energy consumption per year in Oldemarkt
Year Gas (m3) Electricity (kWh)
2020 1.420 2.870
2021 1.610 2.950
2022 1.240 2.830
2023 1.030 2.730
2024 980 2.830

Consumption per house type

Hoekwoning

Gas: 910 • Electricity: 2.380

Huurwoning

Gas: 880 • Electricity: 2.000

Koopwoning

Gas: 1.060 • Electricity: 2.850

Appartement

Gas: 730 • Electricity: 1.650

Tussenwoning

Gas: 860 • Electricity: 2.270

Vrijstaande woning

Gas: 1.200 • Electricity: 3.180

Twee-onder-één-kap woning

Gas: 1.030 • Electricity: 2.810

Business activity in Oldemarkt (2025)

Handel en HORECA 50
Nijverheid en energie 70
Zakelijke dienstverlening 70
Overheid, onderwijs en zorg 55
Landbouw, bosbouw en visserij 25
Vervoer, informatie en communicatie 15
Financiele diensten en onroerendgoed 15
Cultuur, recreatie en overige diensten 40

Total number of company establishments: 335

Recent crime statistics

Recent crime statistics in Oldemarkt
Period Crimes
jan 2025 2
jan 2026 5
jul 2025 2
jun 2025 4
mei 2025 3
mrt 2025 4
nov 2024 1
nov 2025 2
okt 2024 0
okt 2025 1
sep 2024 8
sep 2025 2

These figures give an indicative picture of safety trends in the living environment of Oldemarkt.

Frequently asked questions about living in Oldemarkt

Short answers based on current local statistics, handy for a quick comparison of the living environment.

Hoeveel inwoners heeft Oldemarkt?

Oldemarkt telt in 2025 ongeveer 2.705 inwoners.

Wat is de gemiddelde WOZ-waarde in Oldemarkt?

De gemiddelde WOZ-waarde in Oldemarkt is in 2025 circa € 323.000.

Wat is het gemiddelde inkomen per inwoner in Oldemarkt?

Het gemiddelde inkomen per inwoner in Oldemarkt ligt rond € 31.500 per jaar.

Hoe veilig is wonen in Oldemarkt?

Voor het huidige jaar gaat het om ongeveer 40 geregistreerde misdrijven. Gebruik deze cijfers als indicatie en vergelijk trends per periode.

Welke woningtypen komen het meest voor in Oldemarkt?

In Oldemarkt komt vooral "Vrijstaande woningen" veel voor, met ongeveer 517 woningen.

Receive free, non-binding quotes

Compare multiple real estate agents and choose the best match.