Residents
1.925
Last year: 2025
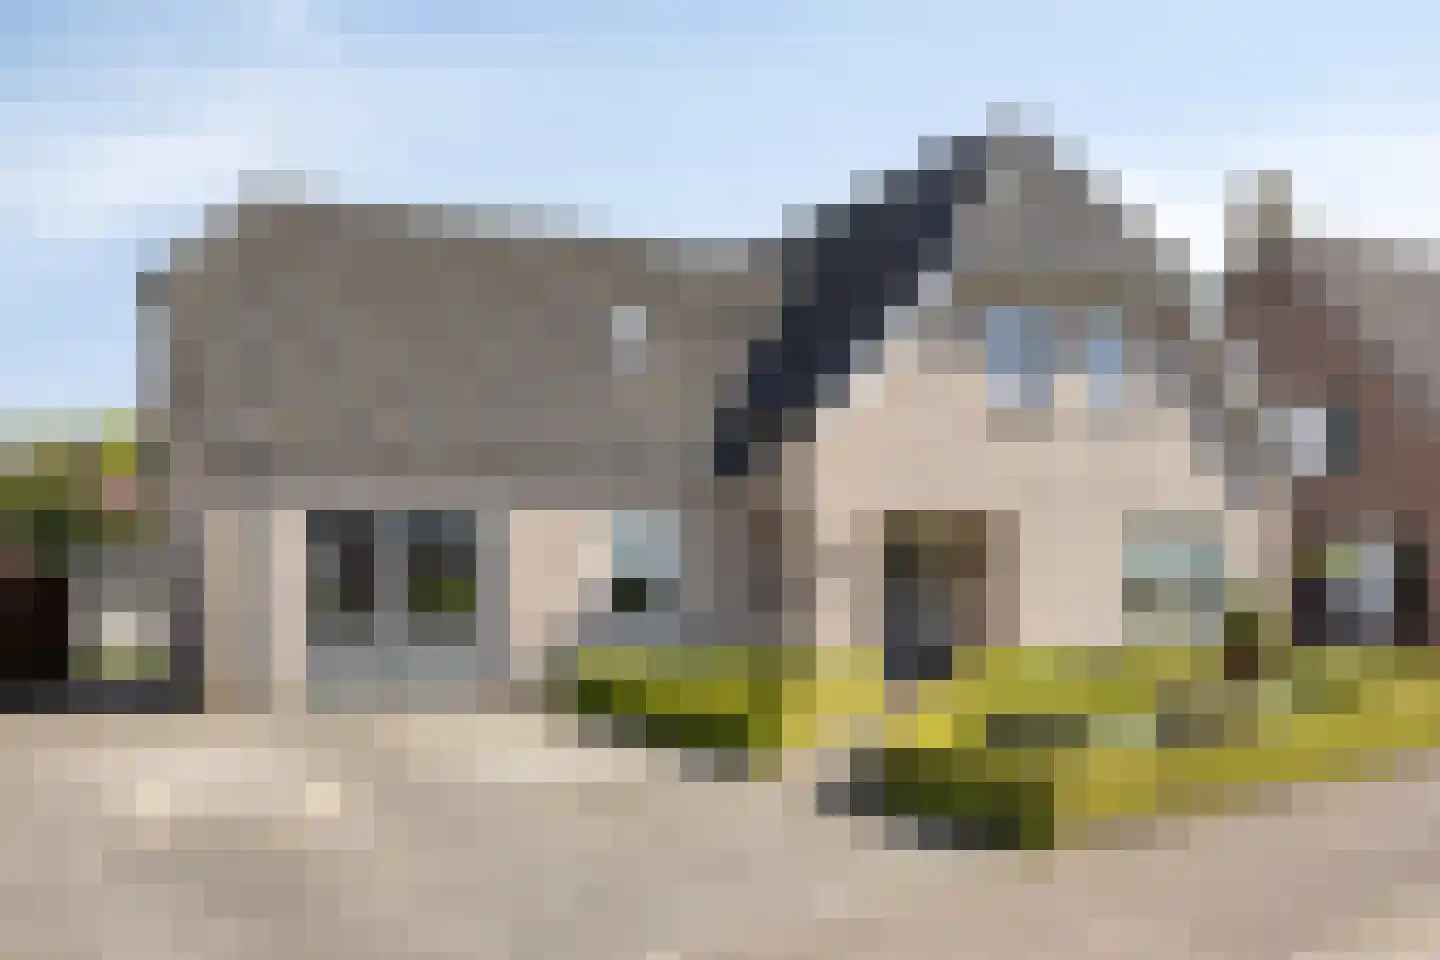
5841BK Oploo • Noord-Brabant
€ 725.000 k.k.
Cost of copper (estimated): € 16.350
2% transfer tax (€ 14.500) + notary (€ 1.150) + valuation (€ 700)
Total incl. VAT: € 741.350
Purchase price /m²: € 4.421
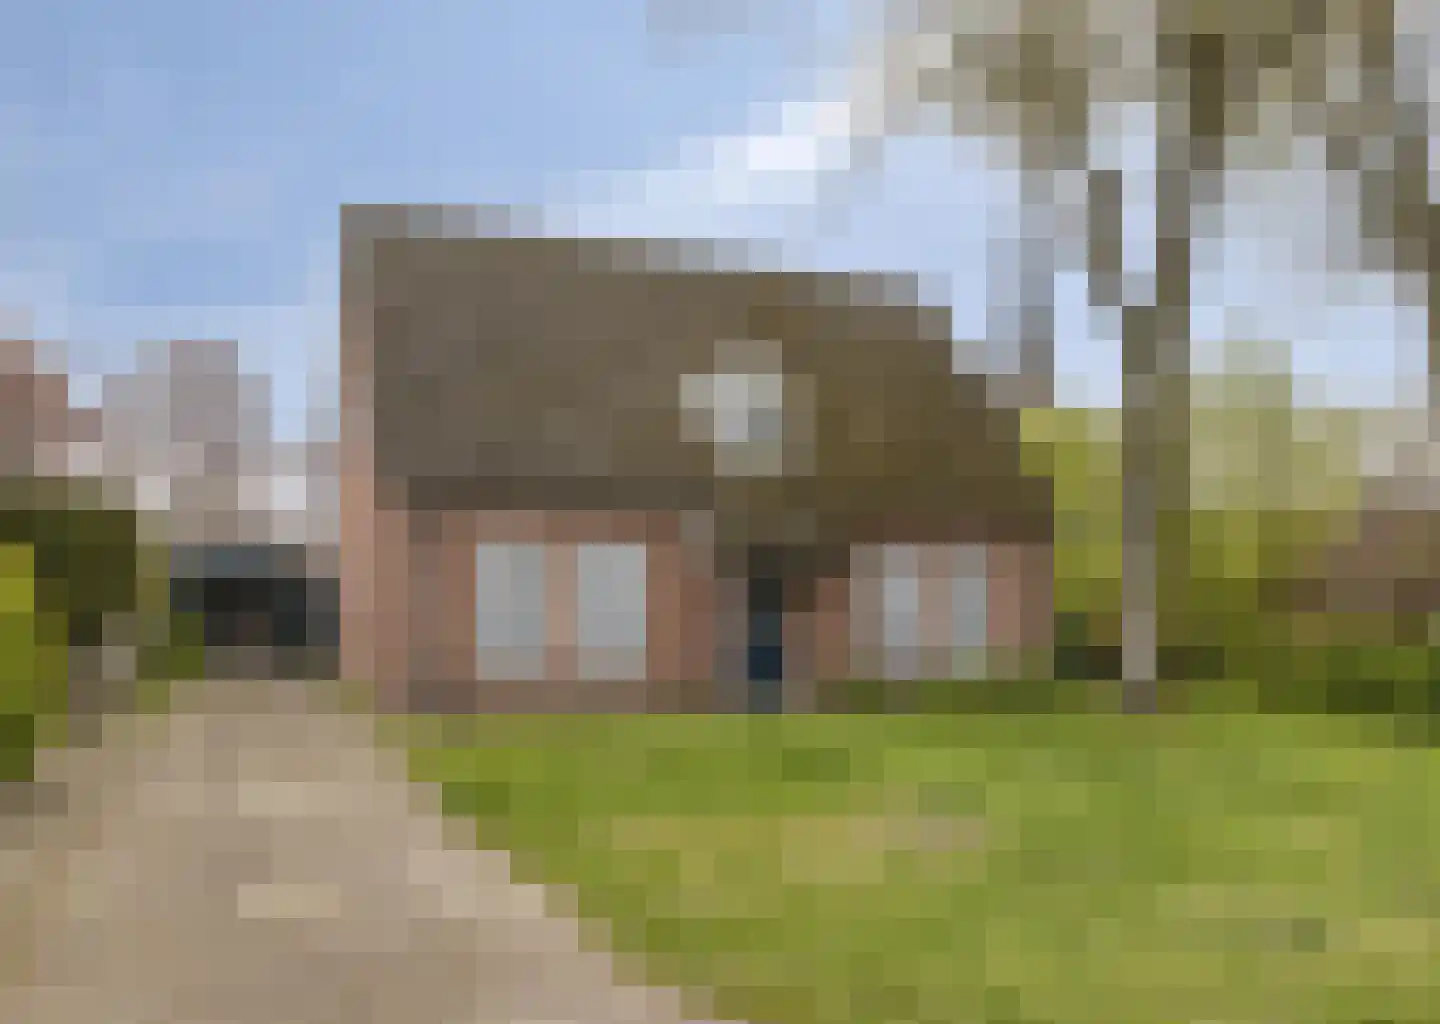
Op een rustige locatie aan de rand van het dorp, in een ruim opgezette en geliefde woonwijk staat deze goed onderhouden vrijstaande gezinswoning. De woning biedt royale leefruimtes, een sfeervolle woonkeuken en maar liefst 4 slaapkamers. De kantoorruimte op de begane grond kan eenvoudig worden ingericht als extra slaap-/ of speelkamer. De fraai aangelegde achtertuin ligt volledig vrij, biedt volop privacy en heeft als absolute eyecatcher een sfeervolle veranda waar je heerlijk kunt genieten van het buitenleven. Indeling: Begane grond: entree/ hal met meterkast en trapopgang naar de 1e verdieping. Een kantoorruimte welke o.a. ingericht kan worden als slaap- of speelkamer. De ruime woonkamer is voorzien van een sfeervolle erker en openslaande tuindeuren welke zorgen voor veel natuurlijke lichtinval. De woonkeuken is voorzien alle benodigde inbouwapparatuur en grenst aan de bijkeuken met toilet en witgoedaansluitingen. 1e verdieping: overloop, 4 ruime slaapkamers, separaat toilet en badkamer voorzien van een ligbad, douchecabine en wastafel. 2e verdieping: via een vlizotrap bereikbare bergzolder met de opstelling van de WTW-unit. Diverse gegevens: De keuken is uitgerust met een 4-pits gaskookplaat, afzuigkap, combioven, koelkast en vaatwasser. CV ketel: van het merk Intergas, bouwjaar 2025. De woning is volledig geïsoleerd. Sfeervol aangelegde achtertuin met veel privacy en riante veranda. Het vrijstaande tuinhuis is voorzien van elektra. De inpandig bereikbare berging/ garage is voorzien van verwarming en een praktische schuifkastenwand. Fraai aangelegde voortuin voorzien van borders. Oploo is voorzien van een supermarkt, een basisschool, een actief verenigingsleven en een gemeenschapshuis. Voor de overige voorzieningen kun je terecht in Sint Anthonis of Boxmeer. Via de nabijgelegen autosnelweg A73 zijn zowel Nijmegen, als Venlo in ca. 30 minuten bereikbaar. Belangrijkste vaste lasten: (volgens opgave huidige gebruiker) Onroerendezaakbelasting: € 537,13 per jaar Rioolrecht: € 271,44 per jaar Afvalstoffenheffing: € 271,80 per jaar Waterschapslasten: € 437,00 per jaar
€ 725.000
Cost of copper (estimated): € 16.350
2% transfer tax (€ 14.500) + notary (€ 1.150) + valuation (€ 700)
Total purchase (incl. p.p.): € 741.350
3,31%
Yearly
€ 36.250
Direct available
Estimated mortgage
Indicative gross monthly cost
Based on annuity and 30 year term
Indicative net monthly cost
iDisclaimer: this mortgage calculation is a simplified indication based on general assumptions. No rights can be derived from the results shown. Calculated with 10-annual interest (zonder NHG), automatically determined based on the price limit € 470.000. Source: 10-jaars rente uit mortgage_rates (14-06-2026 03:45). For non-NHG, an 80% mortgage of the market value has been used in this indication.
Douche, ligbad, en wastafel
Elektra en verwarming
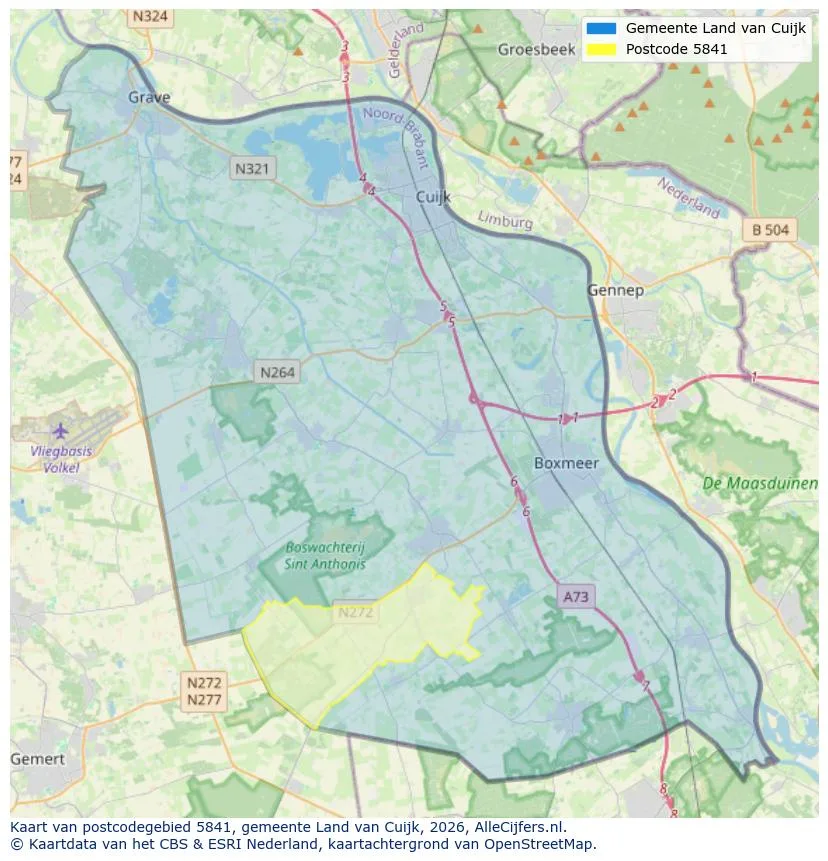
Spatial overview of the work area in Oploo
View current location data on residents, WOZ development, housing stock, energy consumption, business activity and safety in Oploo. In 2025 were there 1.925 residents. The average WOZ value in 2025 is EUR 459.000.
Residents
1.925
Last year: 2025
Average WOZ
EUR 459.000
Last year: 2025
Average income per person.
EUR 32.300
Source: AllNumbers
Crimes (current year)
33
Total registered
| Year | Residents |
|---|---|
| 2021 | 1.895 |
| 2022 | 1.885 |
| 2023 | 1.885 |
| 2024 | 1.890 |
| 2025 | 1.925 |
| Year | Average WOZ |
|---|---|
| 2021 | EUR 328.000 |
| 2022 | EUR 358.000 |
| 2023 | EUR 401.000 |
| 2024 | EUR 432.000 |
| 2025 | EUR 459.000 |
Hoger
410
Praktisch
350
Middelbaar
700
Europa
70
Nederland
1.750
Buiten Europa
105
Label C
156
Label A
135
Label B
135
Label D
106
Label G
104
Label F
58
Label A+++
37
Label E
27
Label A++++
6
Label A+
5
Label A++
5
Label A+++++
0
| Year | Gas (m3) | Electricity (kWh) |
|---|---|---|
| 2020 | 1.600 | 3.690 |
| 2021 | 1.810 | 3.730 |
| 2022 | 1.380 | 3.570 |
| 2023 | 1.130 | 3.330 |
| 2024 | 1.070 | 3.430 |
Hoekwoning
Gas: 930 • Electricity: 2.750
Huurwoning
Gas: 890 • Electricity: 2.230
Koopwoning
Gas: 1.190 • Electricity: 3.600
Appartement
Gas: 880 • Electricity: 2.450
Tussenwoning
Gas: 750 • Electricity: 2.430
Vrijstaande woning
Gas: 1.280 • Electricity: 3.780
Twee-onder-één-kap woning
Gas: 1.020 • Electricity: 2.880
Total number of company establishments: 290
| Period | Crimes |
|---|---|
| jan 2025 | 8 |
| jan 2026 | 4 |
| jul 2025 | 3 |
| jun 2025 | 1 |
| mei 2025 | 3 |
| mrt 2025 | 3 |
| nov 2024 | 5 |
| nov 2025 | 3 |
| okt 2024 | 3 |
| okt 2025 | 2 |
| sep 2024 | 6 |
| sep 2025 | 3 |
These figures give an indicative picture of safety trends in the living environment of Oploo.
Short answers based on current local statistics, handy for a quick comparison of the living environment.
Oploo telt in 2025 ongeveer 1.925 inwoners.
De gemiddelde WOZ-waarde in Oploo is in 2025 circa € 459.000.
Het gemiddelde inkomen per inwoner in Oploo ligt rond € 32.300 per jaar.
Voor het huidige jaar gaat het om ongeveer 33 geregistreerde misdrijven. Gebruik deze cijfers als indicatie en vergelijk trends per periode.
In Oploo komt vooral "Vrijstaande woningen" veel voor, met ongeveer 437 woningen.
View more homes in this location.

5841AB Oploo
€ 300.000 k.k.

5841BJ Oploo
€ 660.000 k.k.
€ 3.750/m²

5841AG Oploo
€ 465.000 k.k.
€ 2.818/m²

5841BB Oploo
€ 485.000 k.k.
€ 4.076/m²
5841AD Oploo
€ 550.000 k.k.
€ 3.618/m²

5841CP Oploo
€ 409.000 k.k.
€ 4.446/m²

5841CV Oploo
€ 679.000 k.k.
€ 3.793/m²

5841CW Oploo
€ 625.000 k.k.
€ 4.401/m²
