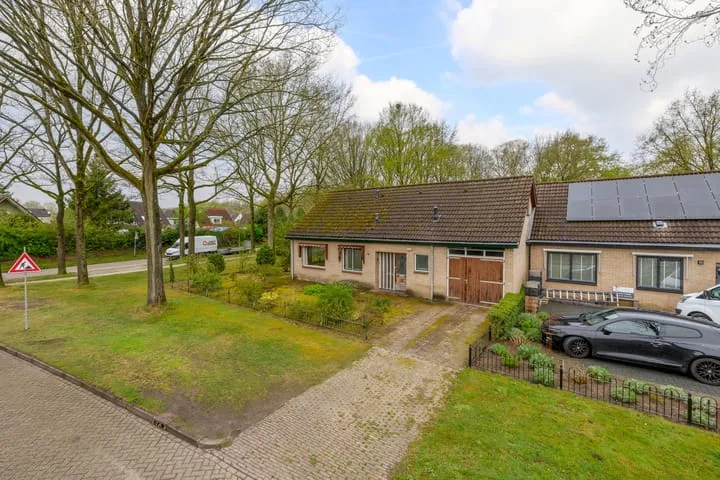
Houses sold in Vledder

View 29 sold houses in Vledder

Connected to: Vastgoed Nederland NVM Makelaars

On this page you will find recently sold homes in Vledder. Use this overview to better estimate selling prices, popular neighborhoods, and the local housing supply before you choose a real estate agent. Also view the current housing supply with 34 houses in Vledder.

Selection

Search and filter homes

Set your preferences and discover homes that suit you.

Total supply 241.800
Filters

Set price, area and other characteristics. Adjust a filter or click on Show homes. Location changes directly above.

Reset filters

You search for

  • Place Vledder
  • Status Sold

Sell your house in Vledder? Compare real estate agents

View recent sales and receive free quotes from local real estate agents. Compare more than 15 real estate agents in Vledder.

Free request a quote

  • Quotes in Vledder
  • Non-binding
  • Personal
  • Compare free rates

Selling your own home in Vledder? Compare real estate agents in Vledder or view the best real estate agents in Vledder as a reference for your choice.

Compare multiple quotes

Real estate agents make sharper offers when they know you're comparing — ask for quotes for sale or purchase.

Frequently asked questions about sold homes in Vledder

Short answers about housing prices, sold homes and comparing real estate agents in Vledder.

Residential and neighborhood statistics in Vledder

View current location data on residents, WOZ development, housing stock, energy consumption, business activity and safety in Vledder. In 2025 were there 2.085 residents. The average WOZ value in 2025 is EUR 383.000.

These figures help to better assess and compare the housing stock in Vledder with recent sold homes. Orient yourself then on suitable top real estate agents in Vledder for sales advice in this region.

Residents

2.085

Last year: 2025

Average WOZ

EUR 383.000

Last year: 2025

Average income per person.

EUR 30.700

Source: AllNumbers

Crimes (current year)

20

Total registered

Demographics and WOZ development

Inhabitants per year

Inhabitants per year in Vledder
Year Residents
2021 1.960
2022 1.980
2023 2.005
2024 2.100
2025 2.085

Annual WOZ value

WOZ value per year in Vledder
Year Average WOZ
2021 EUR 264.000
2022 EUR 285.000
2023 EUR 340.000
2024 EUR 354.000
2025 EUR 383.000

Composition of residents

Age build-up

65+: 840 0-15: 220 15-25: 155 25-45: 325 45-65: 545

Education level

Hoger

440

Praktisch

260

Middelbaar

750

Origin of residents (2025)

Europa

70

Nederland

1.855

Buiten Europa

155

Housing stock and construction periods

Types of homes

Hoekwoningen 97
Appartementen 93
Tussenwoningen 132
Vrijstaande woningen 398
Twee-onder-één-kap woningen 283

Construction period of buildings

Voor 1700 1
1700 tot 1900 20
1900 tot 1925 17
1925 tot 1950 45
1950 tot 1970 197
1970 tot 1980 242
1980 tot 1990 221
1990 tot 2000 258
2000 tot 2010 11
2010 tot 2020 7
2020 en later 45

Energy and sustainability

Energy label distribution

Label C

330

Label B

225

Label A

196

Label D

115

Label F

43

Label G

37

Label E

28

Label A+++

12

Label A++

10

Label A+

5

Label A++++

0

Label A+++++

0

Average energy consumption per year

Average energy consumption per year in Vledder
Year Gas (m3) Electricity (kWh)
2020 1.480 2.700
2021 1.680 2.770
2022 1.290 2.660
2023 1.080 2.560
2024 1.030 2.690

Consumption per house type

Hoekwoning

Gas: 980 • Electricity: 2.090

Huurwoning

Gas: 900 • Electricity: 1.910

Koopwoning

Gas: 1.140 • Electricity: 2.760

Appartement

Gas: 600 • Electricity: 2.150

Tussenwoning

Gas: 890 • Electricity: 1.760

Vrijstaande woning

Gas: 1.310 • Electricity: 2.990

Twee-onder-één-kap woning

Gas: 990 • Electricity: 2.550

Business activity in Vledder (2025)

Handel en HORECA 30
Nijverheid en energie 45
Zakelijke dienstverlening 50
Overheid, onderwijs en zorg 50
Landbouw, bosbouw en visserij 20
Vervoer, informatie en communicatie 10
Financiele diensten en onroerendgoed 5
Cultuur, recreatie en overige diensten 25

Total number of company establishments: 235

Recent crime statistics

Recent crime statistics in Vledder
Period Crimes
jan 2025 2
jan 2026 1
jul 2025 1
jun 2025 2
mei 2025 3
mrt 2025 0
nov 2024 4
nov 2025 1
okt 2024 6
okt 2025 2
sep 2024 0
sep 2025 0

These figures give an indicative picture of safety trends in the living environment of Vledder.

Frequently asked questions about living in Vledder

Short answers based on current local statistics, handy for a quick comparison of the living environment.

Hoeveel inwoners heeft Vledder?

Vledder telt in 2025 ongeveer 2.085 inwoners.

Wat is de gemiddelde WOZ-waarde in Vledder?

De gemiddelde WOZ-waarde in Vledder is in 2025 circa € 383.000.

Wat is het gemiddelde inkomen per inwoner in Vledder?

Het gemiddelde inkomen per inwoner in Vledder ligt rond € 30.700 per jaar.

Hoe veilig is wonen in Vledder?

Voor het huidige jaar gaat het om ongeveer 20 geregistreerde misdrijven. Gebruik deze cijfers als indicatie en vergelijk trends per periode.

Welke woningtypen komen het meest voor in Vledder?

In Vledder komt vooral "Vrijstaande woningen" veel voor, met ongeveer 398 woningen.

Receive free, non-binding quotes

Compare multiple real estate agents and choose the best match.