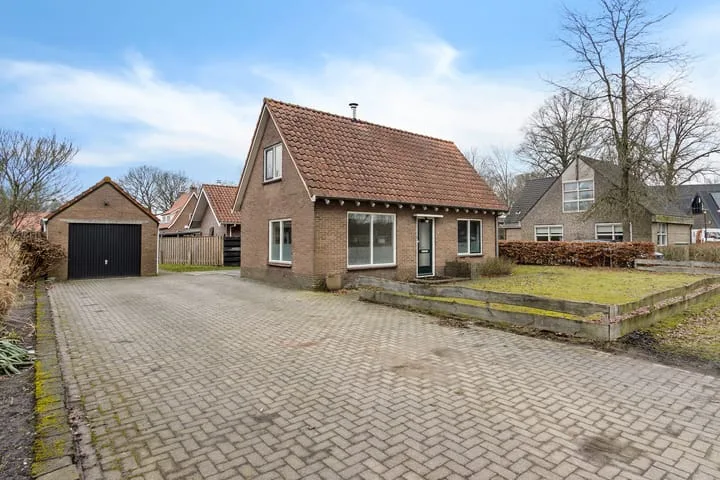
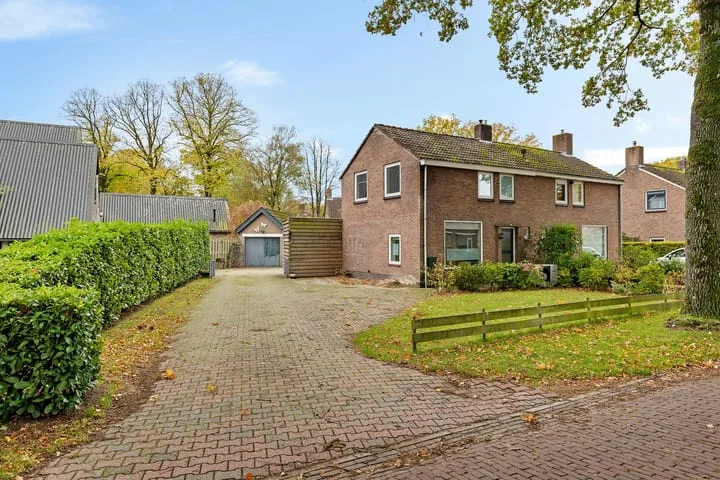
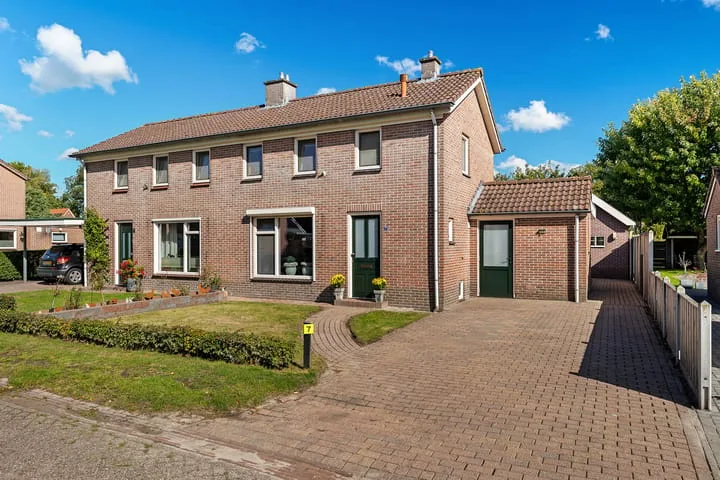
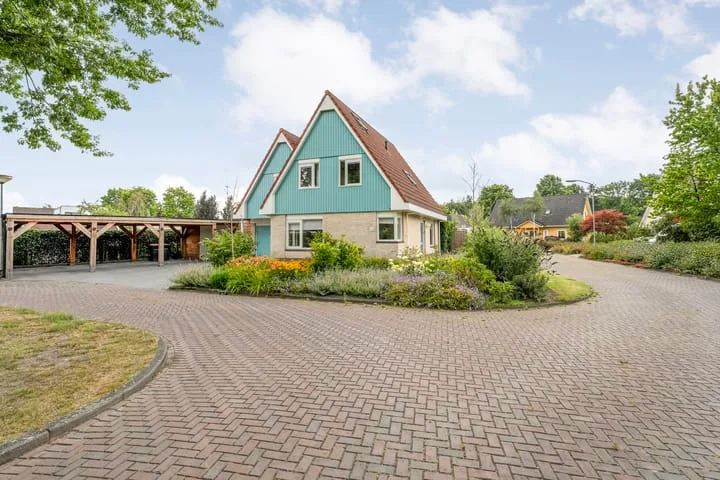
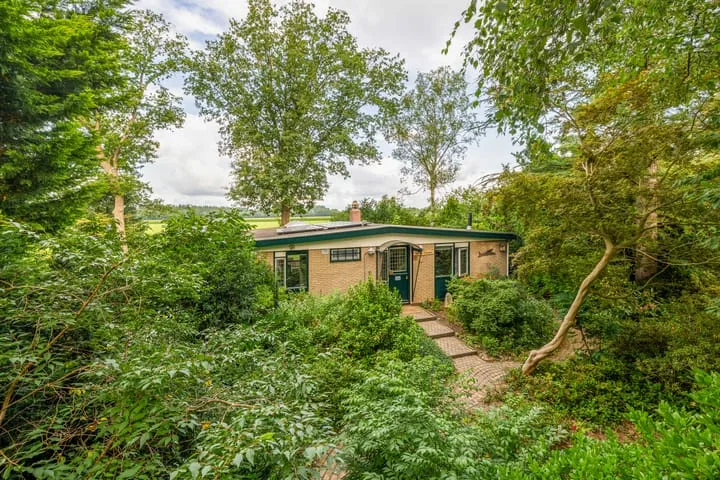
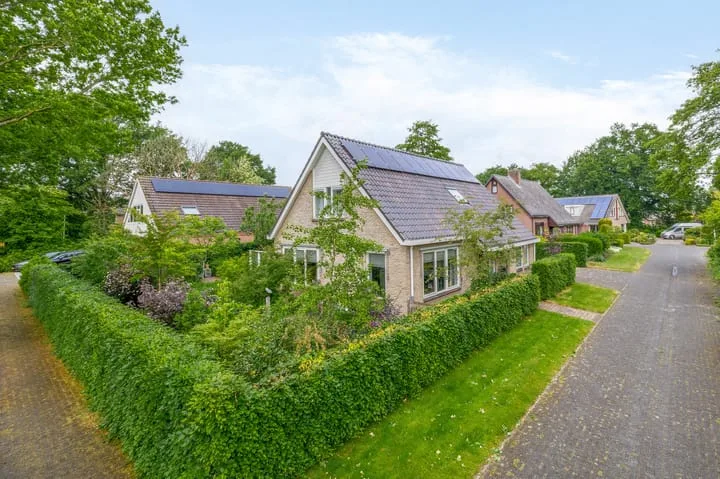
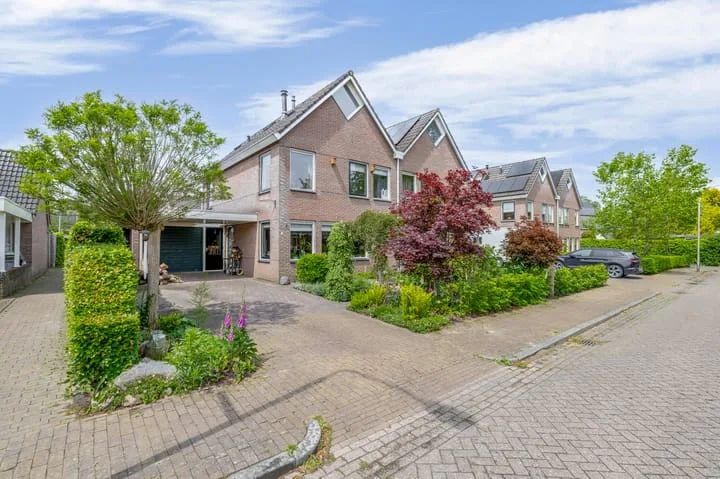
- Sold
Bosbouwkamp 29
8381AG Vledder
€ 575.000 k.k.
€ 4.078/m²
- Living area
- 141 m²
- Land area
- 2508 m²
- Bedrooms
- 2
View 29 sold houses in Vledder
Type to search. Use arrow down and arrow up to navigate through results and press Enter to open.
Hidden search suggestions.
Compare sold homes in Vledder or view the current offering in this location directly.
On this page you will find recently sold homes in Vledder. Use this overview to better estimate selling prices, popular neighborhoods, and the local housing supply before you choose a real estate agent. Also view the current housing supply with 34 houses in Vledder.
8381AG Vledder
€ 575.000 k.k.
€ 4.078/m²
8381AA Vledder
€ 350.000 k.k.
€ 3.763/m²
8381CZ Vledder
€ 389.500 k.k.
€ 3.781/m²
8381CN Vledder
€ 309.500 k.k.
€ 3.517/m²
8381BN Vledder
€ 305.000 k.k.
€ 3.465/m²
8381AC Vledder
€ 1.190.000 k.k.
€ 4.524/m²
8381CZ Vledder
€ 398.000 k.k.
€ 5.102/m²
8381AB Vledder
€ 498.000 k.k.
€ 3.018/m²
8381BN Vledder
€ 359.000 k.k.
€ 3.293/m²
8381CR Vledder
€ 449.500 k.k.
€ 4.086/m²
8381CN Vledder
€ 315.000 k.k.
€ 3.461/m²
8381AL Vledder
€ 410.000 k.k.
€ 4.361/m²
8381CN Vledder
€ 469.000 k.k.
€ 4.737/m²
8381BX Vledder
€ 350.000 k.k.
€ 4.430/m²
8381AK Vledder
€ 325.000 k.k.
€ 3.037/m²
8381BX Vledder
€ 375.000 k.k.
€ 3.906/m²
8381DH Vledder
€ 465.000 k.k.
€ 4.189/m²
8381DE Vledder
€ 439.500 k.k.
€ 3.162/m²
8381AP Vledder
€ 389.000 k.k.
€ 3.704/m²
8381DG Vledder
€ 649.000 k.k.
€ 3.470/m²
8381DS Vledder
€ 319.500 k.k.
€ 3.993/m²
8381CR Vledder
€ 375.000 k.k.
€ 3.073/m²
8381DD Vledder
€ 849.000 k.k.
€ 4.796/m²
8381DG Vledder
€ 575.000 k.k.
€ 4.492/m²
8381DE Vledder
€ 498.000 k.k.
€ 3.482/m²
8381CZ Vledder
€ 475.000 k.k.
€ 4.166/m²
8381CC Vledder
€ 595.000 k.k.
€ 3.966/m²
8381CX Vledder
€ 439.000 k.k.
€ 3.048/m²
View recent sales and receive free quotes from local real estate agents. Compare more than 15 real estate agents in Vledder.
Selling your own home in Vledder? Compare real estate agents in Vledder or view the best real estate agents in Vledder as a reference for your choice.
Real estate agents make sharper offers when they know you're comparing — ask for quotes for sale or purchase.
Short answers about housing prices, sold homes and comparing real estate agents in Vledder.
The costs of a real estate agent in Vledder vary per office, property type and sales approach. In Vledder you can compare 15 real estate agents; therefore also look at the real estate agents in Vledder to better compare fees, presentation and local experience.
On this page we currently show 29 sold houses in Vledder from our selection. This helps you to better assess recent transactions and the local housing market.
Houses sold in Vledder give insight into asking prices, house types and neighborhoods where recent transactions have taken place. Compare this also with the current housing stock in Vledder to better understand the market.
You can use sold homes as a first market indication, but a local real estate agent can better take into account finishing, location, maintenance and current demand in Vledder.
Compare the 15 real estate agents in Vledder on local sales experience, reviews, expected yield, commission and marketing approach. View real estate agents in Vledder or the top 10 agents in Vledder to quickly discover strong offices.
View current location data on residents, WOZ development, housing stock, energy consumption, business activity and safety in Vledder. In 2025 were there 2.085 residents. The average WOZ value in 2025 is EUR 383.000.
These figures help to better assess and compare the housing stock in Vledder with recent sold homes. Orient yourself then on suitable top real estate agents in Vledder for sales advice in this region.
Residents
2.085
Last year: 2025
Average WOZ
EUR 383.000
Last year: 2025
Average income per person.
EUR 30.700
Source: AllNumbers
Crimes (current year)
20
Total registered
| Year | Residents |
|---|---|
| 2021 | 1.960 |
| 2022 | 1.980 |
| 2023 | 2.005 |
| 2024 | 2.100 |
| 2025 | 2.085 |
| Year | Average WOZ |
|---|---|
| 2021 | EUR 264.000 |
| 2022 | EUR 285.000 |
| 2023 | EUR 340.000 |
| 2024 | EUR 354.000 |
| 2025 | EUR 383.000 |
Hoger
440
Praktisch
260
Middelbaar
750
Europa
70
Nederland
1.855
Buiten Europa
155
Label C
330
Label B
225
Label A
196
Label D
115
Label F
43
Label G
37
Label E
28
Label A+++
12
Label A++
10
Label A+
5
Label A++++
0
Label A+++++
0
| Year | Gas (m3) | Electricity (kWh) |
|---|---|---|
| 2020 | 1.480 | 2.700 |
| 2021 | 1.680 | 2.770 |
| 2022 | 1.290 | 2.660 |
| 2023 | 1.080 | 2.560 |
| 2024 | 1.030 | 2.690 |
Hoekwoning
Gas: 980 • Electricity: 2.090
Huurwoning
Gas: 900 • Electricity: 1.910
Koopwoning
Gas: 1.140 • Electricity: 2.760
Appartement
Gas: 600 • Electricity: 2.150
Tussenwoning
Gas: 890 • Electricity: 1.760
Vrijstaande woning
Gas: 1.310 • Electricity: 2.990
Twee-onder-één-kap woning
Gas: 990 • Electricity: 2.550
Total number of company establishments: 235
| Period | Crimes |
|---|---|
| jan 2025 | 2 |
| jan 2026 | 1 |
| jul 2025 | 1 |
| jun 2025 | 2 |
| mei 2025 | 3 |
| mrt 2025 | 0 |
| nov 2024 | 4 |
| nov 2025 | 1 |
| okt 2024 | 6 |
| okt 2025 | 2 |
| sep 2024 | 0 |
| sep 2025 | 0 |
These figures give an indicative picture of safety trends in the living environment of Vledder.
Short answers based on current local statistics, handy for a quick comparison of the living environment.
Vledder telt in 2025 ongeveer 2.085 inwoners.
De gemiddelde WOZ-waarde in Vledder is in 2025 circa € 383.000.
Het gemiddelde inkomen per inwoner in Vledder ligt rond € 30.700 per jaar.
Voor het huidige jaar gaat het om ongeveer 20 geregistreerde misdrijven. Gebruik deze cijfers als indicatie en vergelijk trends per periode.
In Vledder komt vooral "Vrijstaande woningen" veel voor, met ongeveer 398 woningen.