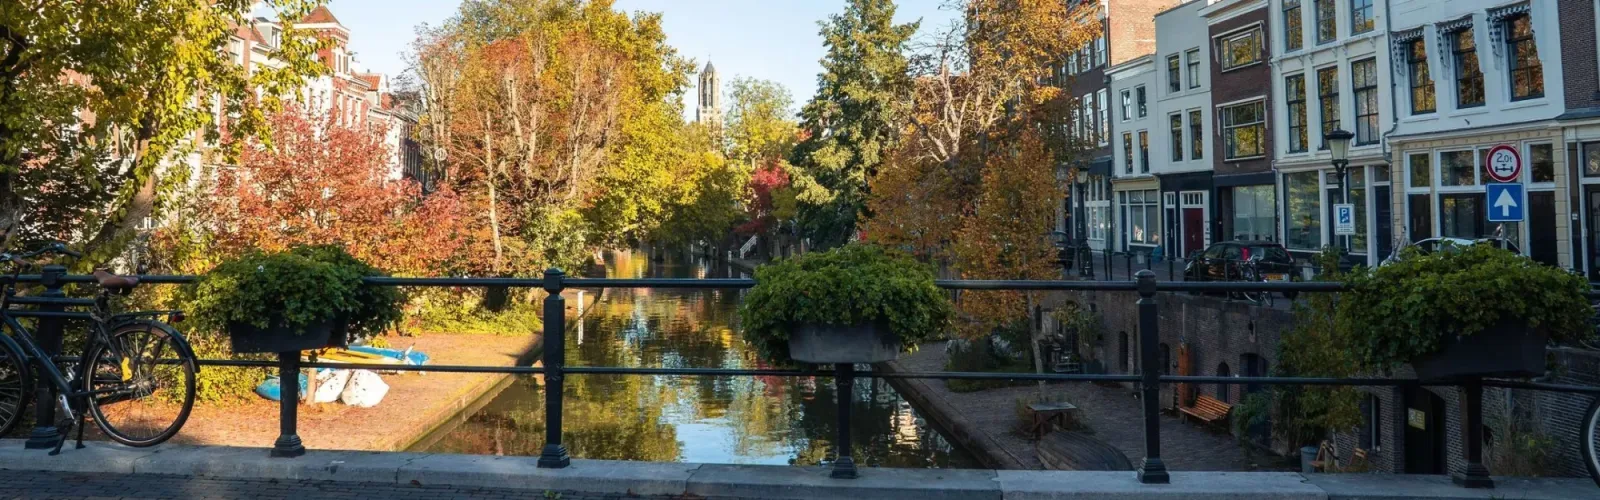
All brokers in Meerkerk

In Meerkerk zijn 107 real estate agents actief

Connected to: Vastgoed Nederland NVM Makelaars

Compare all brokers in Meerkerk

107 real estate agents in Meerkerk average a 9.1 out of 6.382 ratings!

Who is the best realtor in Meerkerk?

Free offer comparison

  • Quotes in Meerkerk
  • Non-binding
  • Personal
  • Free property website

🥇 Get better quotes: brokers offer better when they know they are being compared! To find the best sales broker or purchasing broker for your situation, we ask you a few questions about your personal circumstances. After that, you will receive non-binding offers for selling or buying a house from the best brokers. Is your property then on Funda? Then you will receive a special home website for your house completely free of charge!

What does a real estate agent cost in Meerkerk?

Compare brokers in Meerkerk

Find the perfect real estate agent in Meerkerk by carefully comparing quotes and services. In a high-end housing market like Meerkerk, the right real estate agent is essential for optimal sales or purchase results. Due to the large competition between brokers in Meerkerk, attractive rates can be found. Start requesting quotes today and find the ideal real estate agent who fits your specific situation.

Broker fees in Meerkerk

With an average property value of €541.544 in Meerkerk, real estate agent fees for sale or purchase are usually between €2.900,- and €9.600,-. The fee structure for a buyer's agent or selling agent varies: some work with a combination of startup costs and commission (1-2% of the sale price), while others charge a fixed rate. By comparing different quotes, you will find the agent who offers the best price-quality ratio for your specific situation.

Business activity in Meerkerk

De bedrijvigheid in Meerkerk laat een brede en gevarieerde lokale economie zien, met ruimte voor zowel gevestigde ondernemers als nieuwe initiatieven. Met 49 NVM-makelaars in Meerkerk is de vastgoedmarkt professioneel georganiseerd en actief. In combinatie met de bevolkingsopbouw en opleidingsniveaus geeft dit een praktisch beeld van de economische dynamiek in de omgeving.

Housing market analysis Zederik

Current market overview for home buyers and sellers in Zederik

Average house prices in Meerkerk

Average house price last month

€541.544,-

In Meerkerk the housing market is currently very dynamic with prices well above the national average. Relevant for those who want to sell or buy a house. Based on 490 recent transactions with a high number of recent transactions in the region.

These averages are indicative and help with orientation when buying or selling a house.

Apartments

€373.665,-

Average price

Terraced houses

€509.051,-

Average price

Corner houses

€487.390,-

Average price

Bungalow

€828.562,-

Average price

two-under-one-roof

€693.176,-

Average price

Detached

€752.746,-

Average price

Comparison of brokerage fees in Meerkerk

Rates are based on the average house price of €541.544 in Meerkerk.

Agent type Startup costs Brokerage Total price
FSBO (self selling)
€0,- 0% €0,-
Internet broker
€1.595,- 0% €1.595,-
Freelance broker
€0,- 1,00% €5.415,-
Vastgoed NL real estate agent
€495,- 1,20% €6.994,-
NVM real estate agent
€695,- 1,35% €8.006,-

An online real estate agent does everything except viewings; you do those yourself.

The above prices are indicative and may vary by broker. Always request multiple quotes for an accurate price comparison.

All amounts are inclusive of 21% VAT.

Market information for sales & purchase brokers in Meerkerk

Current statistics for when you want to buy or sell a house and information about purchase & sale brokers in Meerkerk

How is the housing market in Meerkerk?

How much competition is there in Meerkerk?

How many brokers are active in Meerkerk?

In Meerkerk there are 107 active brokers available to help you as a buyer's agent or seller's agent with buying or selling a house. Finding the right broker can be a challenge, but by comparing brokers in Meerkerk on expertise, price and reviews, you can make an informed choice. Our platform provides an overview of all brokers in Meerkerk.

How many brokers are located in Meerkerk?

There are no brokers located in Meerkerk. These brokers often have extensive knowledge of the housing market in your region. Whether you want to sell or buy a house, a sales or purchase broker in Meerkerk can guide you through every step of the process. Easily compare brokers and receive quotes to see which broker best suits your needs.

What is the average rating of brokers in Meerkerk?

Real estate agents in Meerkerk average a score of 9.1 out of 6382 reviews. These high scores provide insight into the satisfaction of previous clients. When choosing a real estate agent, however, it is also important to pay attention to their specializations, experience and rates. On our platform you can compare real estate agents in Meerkerk and make the ideal choice based on your personal preferences.

What is the average asking price in Meerkerk?

The average asking price in Meerkerk is €541.544,- based on maart data from 490 registered properties. This price is an indication of current trends in the housing market in Meerkerk. Whether you want to buy or sell a house, a purchasing or selling broker in Meerkerk can help you make the most of this market and achieve your goals.

How many NVM real estate agents are there in Meerkerk?

In Meerkerk there are 49 NVM real estate agents active. These agents offer a guarantee of quality and professionalism because they are bound by strict guidelines. By choosing an NVM agent, you benefit from extensive knowledge and experience in the housing market of Meerkerk. View and compare NVM agents on our platform to find your ideal match.

How many Real Estate Netherlands agents are there in Meerkerk?

There are 11 Real Estate Netherlands brokers active in Meerkerk. Real Estate Netherlands brokers are known for their flexible services and customer-focused approach. They offer expert advice and guide you through the entire process of buying, selling or renting. Discover which Real Estate NL broker in Meerkerk best suits your needs.

Everything you want to know about real estate agents in Meerkerk

Answers to frequently asked questions about choosing and working with brokers in the region

Meerkerk on the map

View the location and discover the brokers in this region

Residential and neighborhood statistics in Meerkerk

View current location data on residents, WOZ development, housing stock, energy consumption, business activity and safety in Meerkerk. In 2025 were there 4.015 residents. The average WOZ value in 2025 is EUR 420.046.

Residents

4.015

Last year: 2025

Average WOZ

EUR 420.046

Last year: 2025

Average income per person.

EUR 26.752

Source: AllNumbers

Crimes (current year)

109

Total registered

Demographics and WOZ development

Inhabitants per year

Inhabitants per year in Meerkerk
Year Residents
2021 3.860
2022 3.865
2023 3.950
2024 3.960
2025 4.015

Annual WOZ value

WOZ value per year in Meerkerk
Year Average WOZ
2021 EUR 289.407
2022 EUR 351.136
2023 EUR 399.671
2024 EUR 403.231
2025 EUR 420.046

Composition of residents

Age build-up

65+: 885 0-15: 710 15-25: 440 25-45: 955 45-65: 1.020

Education level

Hoger

700

Praktisch

860

Middelbaar

1.320

Origin of residents (2025)

Europa

225

Nederland

3.560

Buiten Europa

230

Housing stock and construction periods

Types of homes

Hoekwoningen 319
Appartementen 204
Tussenwoningen 469
Vrijstaande woningen 535
Twee-onder-één-kap woningen 242

Construction period of buildings

Voor 1700 8
1700 tot 1900 49
1900 tot 1925 137
1925 tot 1950 159
1950 tot 1970 363
1970 tot 1980 284
1980 tot 1990 283
1990 tot 2000 74
2000 tot 2010 213
2010 tot 2020 136
2020 en later 206

Energy and sustainability

Energy label distribution

Label A

477

Label C

400

Label B

288

Label G

228

Label D

169

Label F

102

Label E

50

Label A+

30

Label A++

16

Label A+++

13

Label A++++

4

Label A+++++

1

Average energy consumption per year

Average energy consumption per year in Meerkerk
Year Gas (m3) Electricity (kWh)
2020 1.290 3.110
2021 1.479 3.159
2022 1.161 2.967
2023 973 2.837
2024 949 2.907

Consumption per house type

Hoekwoning

Gas: 701 • Electricity: 2.022

Huurwoning

Gas: 835 • Electricity: 2.210

Koopwoning

Gas: 1.025 • Electricity: 3.117

Appartement

Gas: 755 • Electricity: 2.231

Tussenwoning

Gas: 636 • Electricity: 1.828

Vrijstaande woning

Gas: 1.271 • Electricity: 3.692

Twee-onder-één-kap woning

Gas: 1.065 • Electricity: 3.075

Business activity in Meerkerk (2025)

Handel en HORECA 105
Nijverheid en energie 160
Zakelijke dienstverlening 175
Overheid, onderwijs en zorg 70
Landbouw, bosbouw en visserij 40
Vervoer, informatie en communicatie 30
Financiele diensten en onroerendgoed 45
Cultuur, recreatie en overige diensten 30

Total number of company establishments: 650

Recent crime statistics

Recent crime statistics in Meerkerk
Period Crimes
jan 2026 4
jul 2025 8
jun 2025 8
mei 2025 10
mrt 2025 8
mrt 2026 15
nov 2024 8
nov 2025 12
okt 2024 12
okt 2025 7
sep 2024 6
sep 2025 12

These figures give an indicative picture of safety trends in the living environment of Meerkerk.

Frequently asked questions about living in Meerkerk

Short answers based on current local statistics, handy for a quick comparison of the living environment.

Hoeveel inwoners heeft Meerkerk?

Meerkerk telt in 2025 ongeveer 4.015 inwoners.

Wat is de gemiddelde WOZ-waarde in Meerkerk?

De gemiddelde WOZ-waarde in Meerkerk is in 2025 circa € 420.046.

Wat is het gemiddelde inkomen per inwoner in Meerkerk?

Het gemiddelde inkomen per inwoner in Meerkerk ligt rond € 26.752 per jaar.

Hoe veilig is wonen in Meerkerk?

Voor het huidige jaar gaat het om ongeveer 109 geregistreerde misdrijven. Gebruik deze cijfers als indicatie en vergelijk trends per periode.

Welke woningtypen komen het meest voor in Meerkerk?

In Meerkerk komt vooral "Vrijstaande woningen" veel voor, met ongeveer 535 woningen.

Actuele kennisartikelen

Discover everything about real estate agents and the housing market