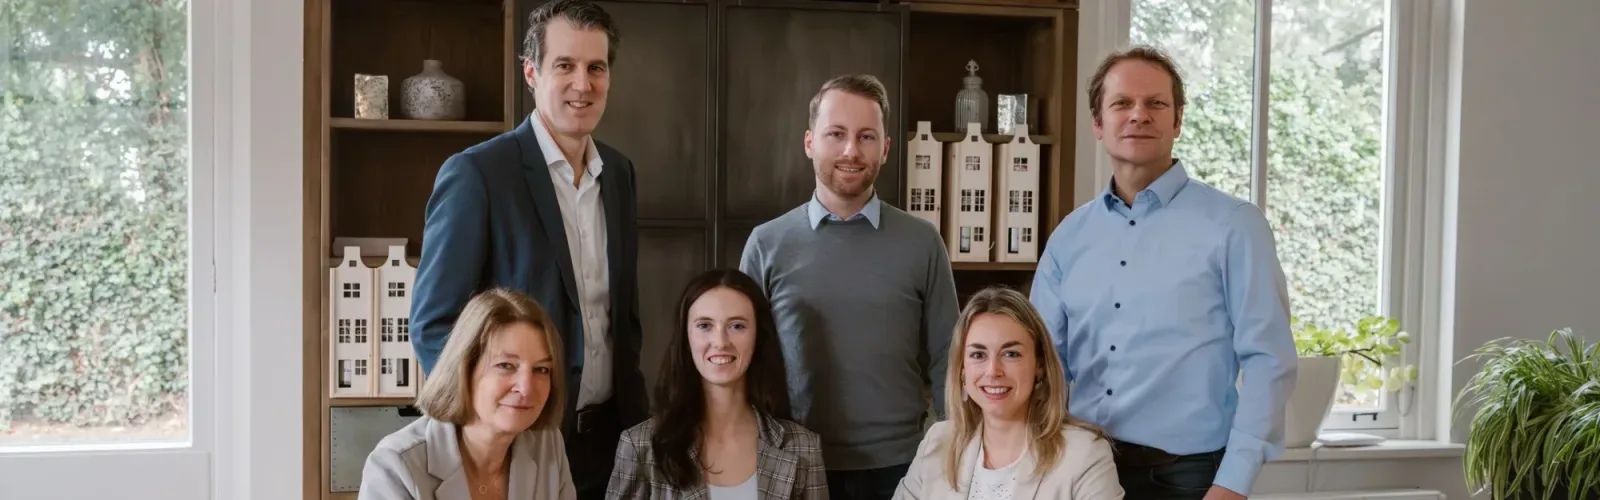
Wels Makelaardij
Wels Makelaardij is your reliable partner in the real estate world, established in Soesterberg. We stand for personal advice and transparent communication, with the aim of successfully guiding you through the purchase or sale of your home. In a region where the market is changing quickly, we offer you professional, tailored support. We provide services such as purchase, sale, rental and financial advice. Our approach is focused on open...
Current housing stock
-

- Available
Amersfoortsestraat 77 B
3769AE Soesterberg
€ 895.000 k.k.
Save as favorite- Living area
- 183 m²
- Land area
- 1470 m²
- Bedrooms
- 5
-

- Available
Christiaan Huygenslaan 129
3769XT Soesterberg
€ 565.000 k.k.
BSave as favorite- Living area
- 110 m²
- Land area
- 200 m²
- Bedrooms
- 4
-

- Available
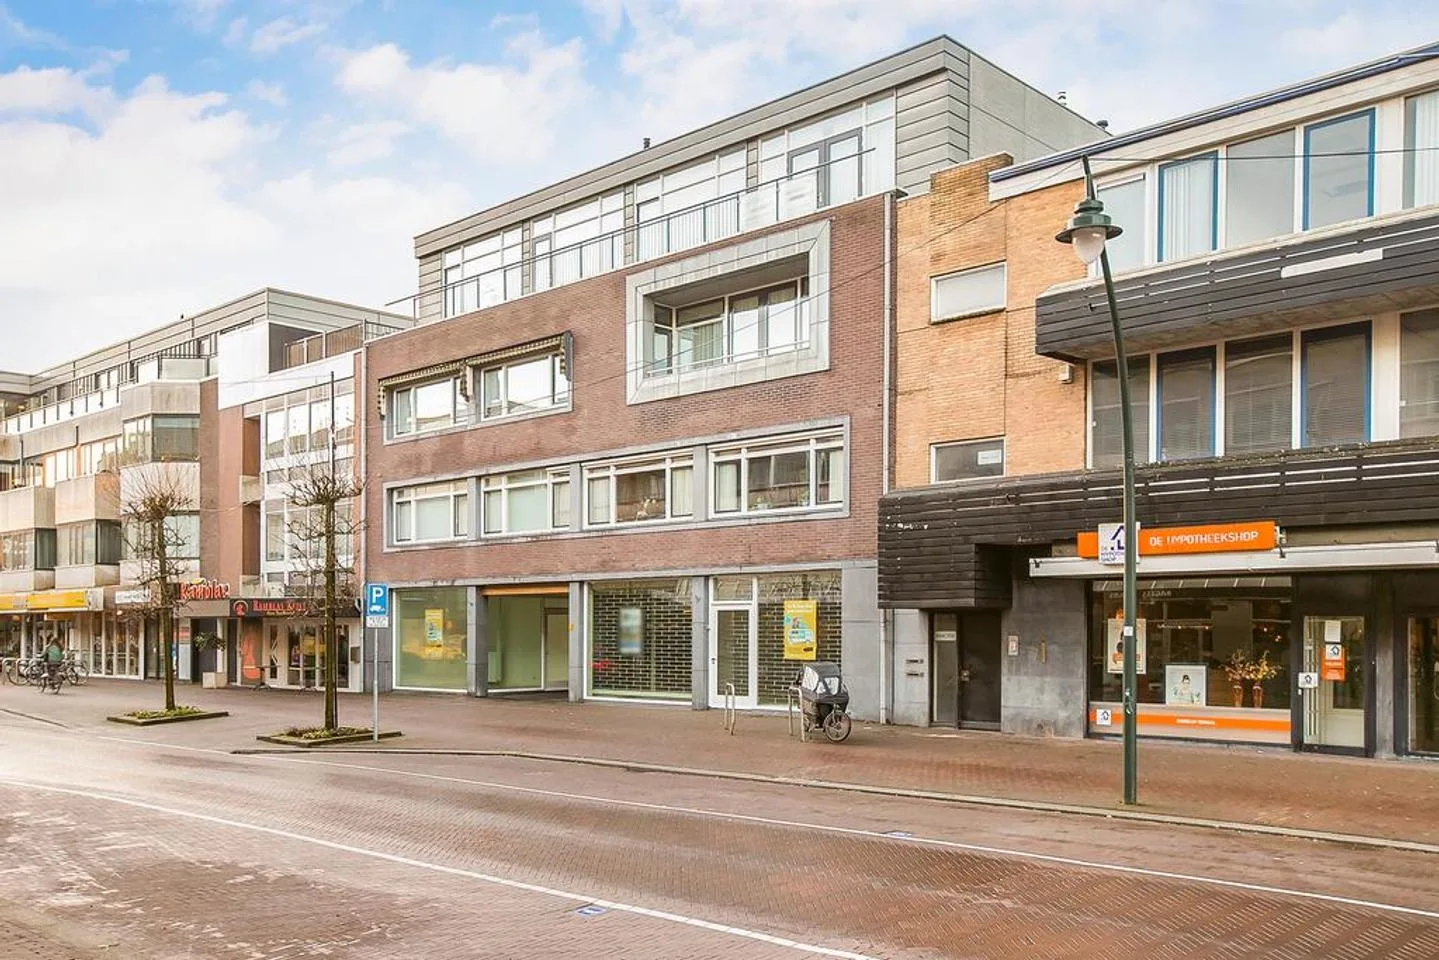
Generaal Winkelmanstraat 126
3769EH Soesterberg
€ 750.000 k.k.
€ 4.412/m²
DSave as favorite- Living area
- 170 m²
- Land area
- 575 m²
- Bedrooms
- 5
-

- Available
Generaal Winkelmanstraat 134
3769EH Soesterberg
€ 650.000 k.k.
€ 5.652/m²
CSave as favorite- Living area
- 115 m²
- Land area
- 357 m²
- Bedrooms
- 3
-

- Available
Simon Stevinlaan 118
3769VK Soesterberg
€ 389.000 k.k.
€ 5.638/m²
CSave as favorite- Living area
- 69 m²
- Land area
- —
- Bedrooms
- 2
-

- Under consideration
Vliegtuiglaan 4
3769JN Soesterberg
€ 750.000 k.k.
€ 5.172/m²
ASave as favorite- Living area
- 145 m²
- Land area
- 335 m²
- Bedrooms
- 4
Reviews (52)
Review platforms
BronscoresTotal score
52 total reviews

52 reviews on Google
-
Jasper Smits
10Translated by AIExcellently helped by Liam; When we came to him, we already had a house in sight. He then promptly calculated our finances for an offer on this property. That didn't work out, but shortly after another very nice house was found. Because we had taken a total package, we were really fully supported: building inspection, mortgage advice, appraisal, communication with the notary, and at every step they also thought about how we could get the best deal. Moreover, he was also (almost) always available to us when we had questions, comments or concerns. In short: Very satisfied with how Liam de Bruin guided us through the entire process from searching to signing at the notary. I would recommend him based on our experience to everyone.
-
Nathan Angelo
2Translated by AIUnfortunately, the communication and arrogance of both Michel and Liam were really a letdown.
-
B Donk
10Translated by AIWe are very satisfied with Wels Makelaardij. Michel is a very positive and enthusiastic real estate agent, he thinks well with you. He has a good and large network in Soesterberg and sold our house quickly, for the market. What we also found nice is that it was not so businesslike and formal, but just friendly! Thank you Michel, and of course Liam for the work behind the scenes.
-
Yaela Perk
10Translated by AIWe are extremely satisfied with Wels Real Estate. Both Michel and Liam are always available and friendly, work professionally and answer all your questions quickly. In short, an extremely nice guidance when buying and selling. Looking for a good real estate agent? With Wels Real Estate, you're in good hands!
-
Michael Arvin
10Translated by AIExcellent service, well cared for. Recommended.
-
César Costa
10Translated by AIProfessional, reliable and pleasant to work with. Michel and Liam have done everything to make sure that everything runs smoothly and successfully. I wholeheartedly recommend them.
-
margaretha Gerrits
10Translated by AIVery satisfied with both Michel and Liam, they are always easily accessible and extremely friendly. The process is clearly outlined in advance and you get a good idea of how they work. My house was sold within 11 days and the subsequent process is also well guided (also for the buyers). I would definitely recommend working with them.
-
Familie Dissel
10Translated by AIIncredibly pleasant communication! Always available and our house was sold in record time! Are you looking for an honest and decisive real estate agent, choose Wels Makelaardij!
-
Julinda Dyli
10Translated by AIWe bought a house and Wels was the selling agent. We were very satisfied with the help and flexibility during viewings, questions, and assistance during the rental process.
-
Maikel Tammer
10Translated by AIThey helped me well, were always available, communicated nicely and thought along everywhere. Definitely a recommendation!
-
Roy Verkerk
10Translated by AIWe are super satisfied with Wels Makelaardij! The property was sold incredibly fast and for a top price. The communication went very smoothly, always easy to reach, clear and friendly. Definitely a recommendation for everyone who wants to sell their home or buy a property! Michel and Liam, thank you very much!
-
Barbara Stokdijk
10Translated by AIIn the fall of 2020, I let Michel know what my wishes were for my new home. A former American neighborhood, but then a 'wooden' house. On a Thursday at the end of the day, Michel called me:
-
Tijn
10Translated by AIContact was always good, fast and low-threshold. This made the entire purchasing process a lot easier than I had imagined!
-
Peter van de Pol
10Translated by AIThe sale of our house, where we lived for no less than 31 years, through Wels real estate in Soesterberg went smoothly. Wels is the market leader in Soesterberg and not without reason. From the initial consultation to the handling, you work with a very accessible and expert duo, Michel Wels and Liam de Bruin. Clear agreements are made but there is also ample room for your own ideas and wishes. Communication runs smoothly and a trusting relationship quickly develops. Because the sale took a little longer, it was nice to feel space to think along, give feedback and the adjustments to the approach were well received. In exciting moments, someone stands beside you who remains calm and keeps an overview. Thank you very much guys! Warm greetings Peter and Ada
-
Delano De Deugd
10Translated by AIGood service! And they provide good advice!
-
Derek Bast
10Translated by AIGreat service, respond quickly and appropriately. Pleasant and personal contact! Many thanks!
-
Steven Kuijntjes
10Translated by AIMichel and Liam, just like 3 years ago, helped us again excellently with the sale of our house. A regionally well-informed party to do business with.
-
Nick
10Translated by AIMichel helped us with the purchase of our current (dream) home and the sale of our apartment and house, both sold very quickly. Contact was very pleasant and smooth and he was always available to answer all our questions. Thanks Michel and Liam 💪🏻 …
-
Gijs Haage
10 -
Jesse Bresser
10Translated by AIMichel and Liam excellently helped us with the purchase of our first home! Because it was our first house, there was a lot of information coming at us quickly. Michel and Liam guided us very nicely through this, allowing us to find the right way in the confusion of information and documents. We received good explanations and a lot was researched for us. Communication also went smoothly and quickly. The conversations were pleasant and there was a nice atmosphere. In short, excellent service and pleasant people who guide you in buying a home!