
Parkland Real Estate B.V. is a real estate agency that focuses primarily on the mediation of buying and selling homes in and around Den Dolder, Zeist, Bosch en Duin, Huis ter Heide, Bilthoven and the Bilt. We place a lot of emphasis on personal guidance and ensure that customers feel worry-free during the process. With strong knowledge of the region and an involved approach, we are ready for you whether it is about selling your home or...
Current housing stock
-

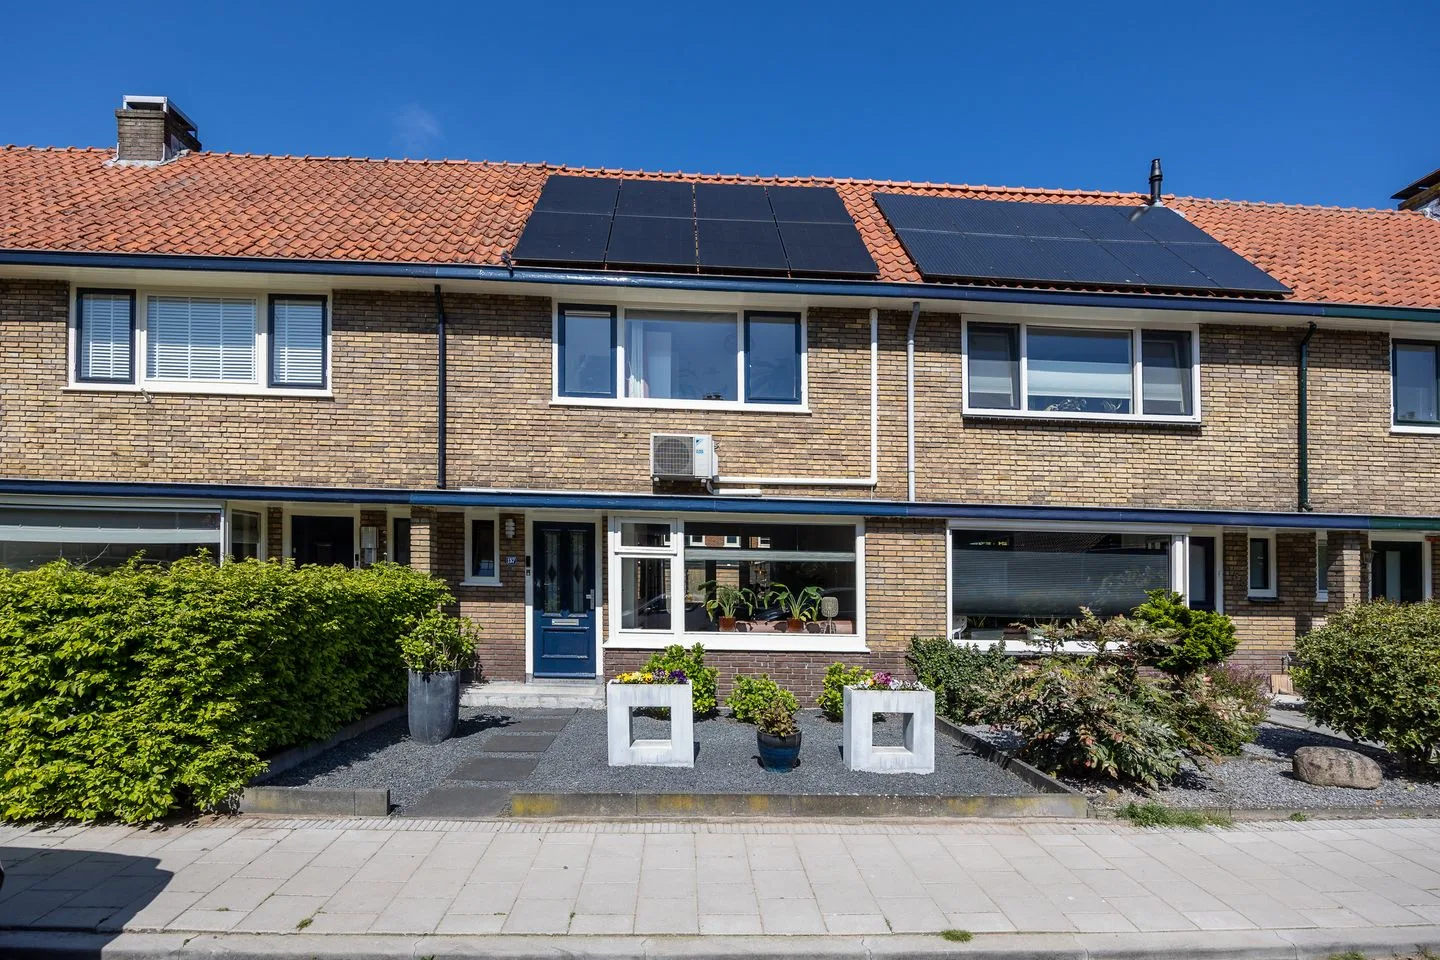
- Available
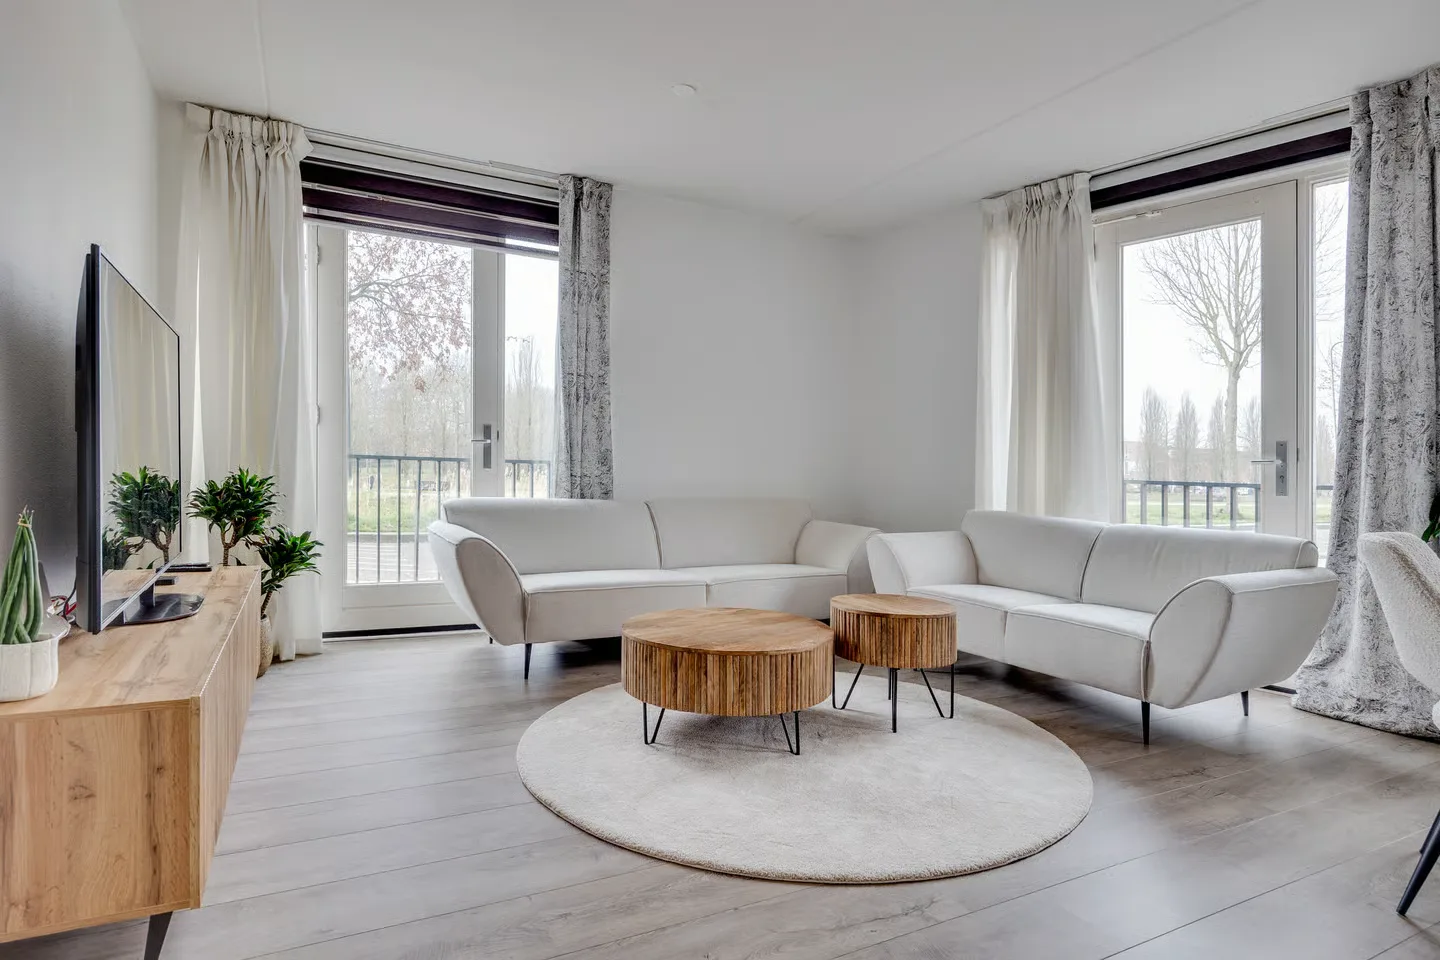
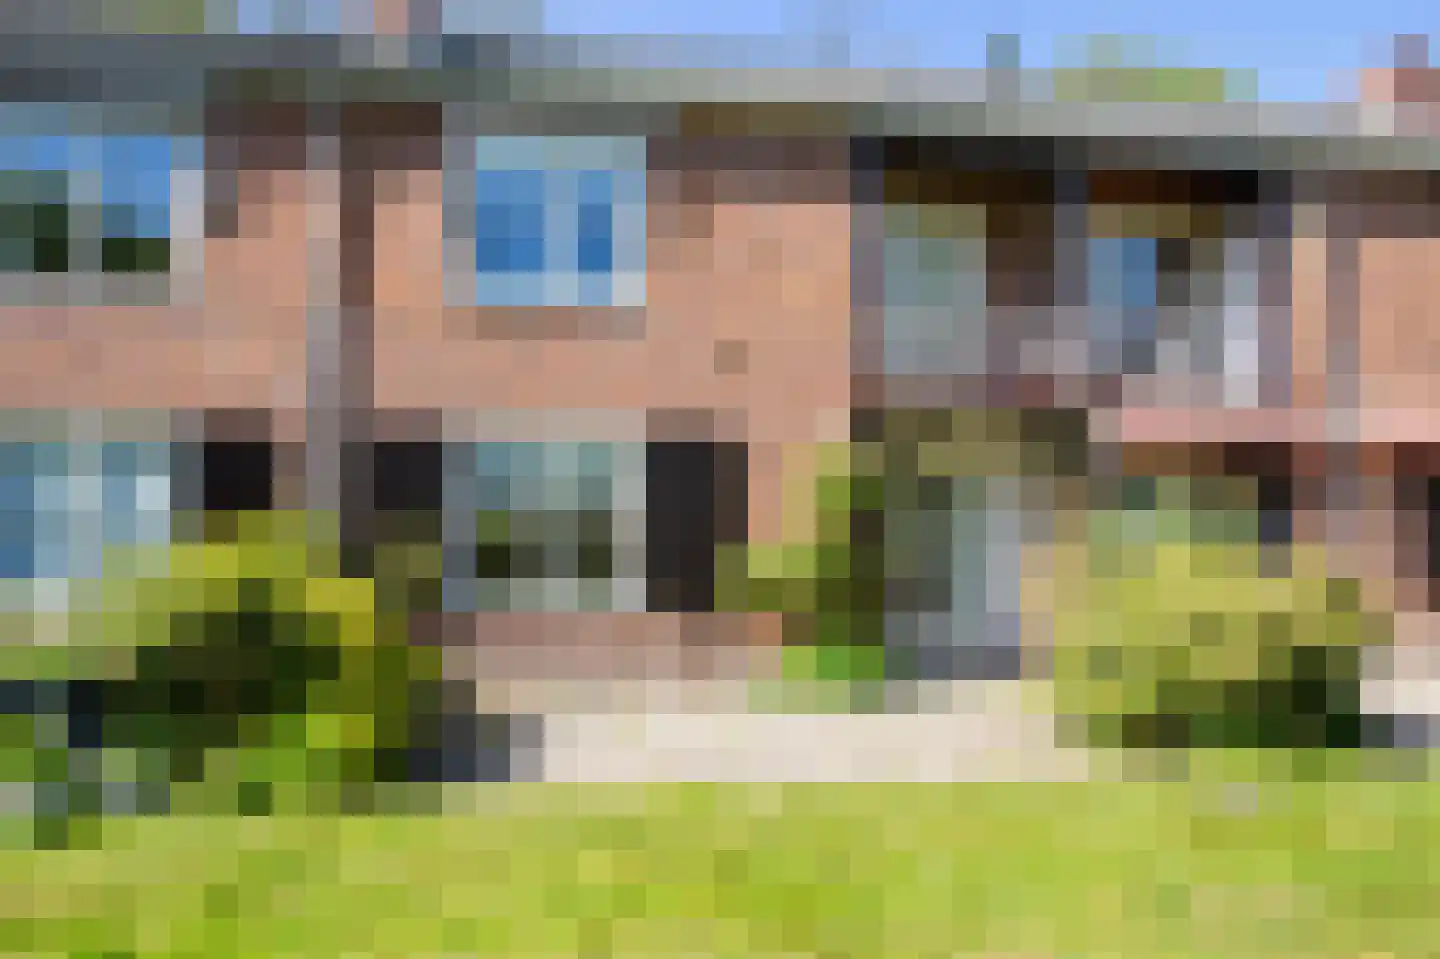
Dierenriem 44
3712XE Huis ter Heide
€ 750.000 k.k.
A+Save as favorite- Living area
- 142 m²
- Land area
- 195 m²
- Bedrooms
- 5
-
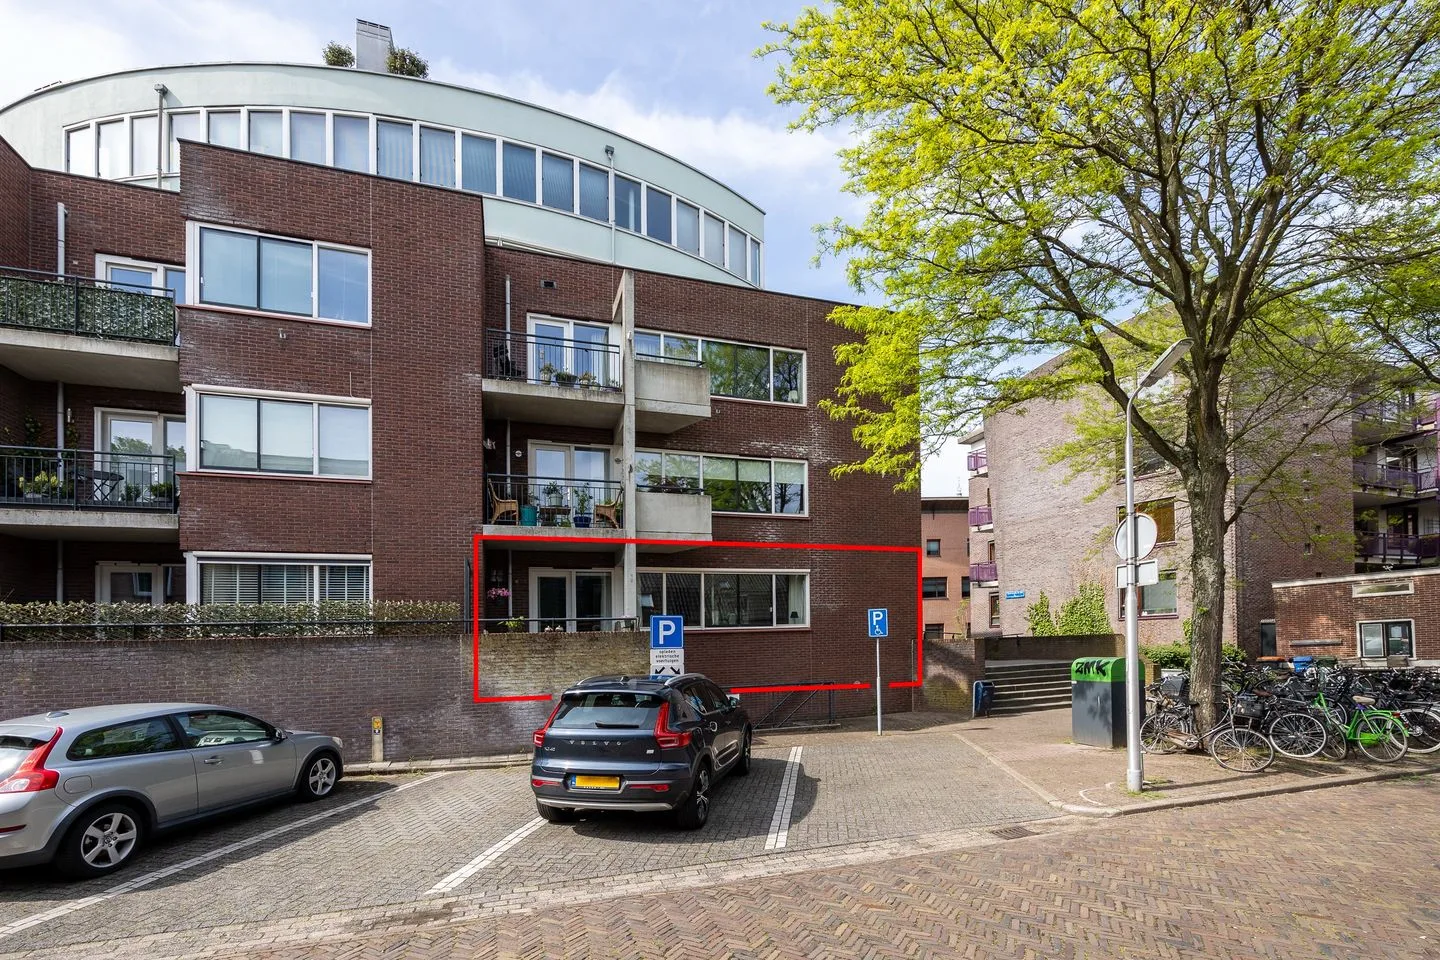
- Available
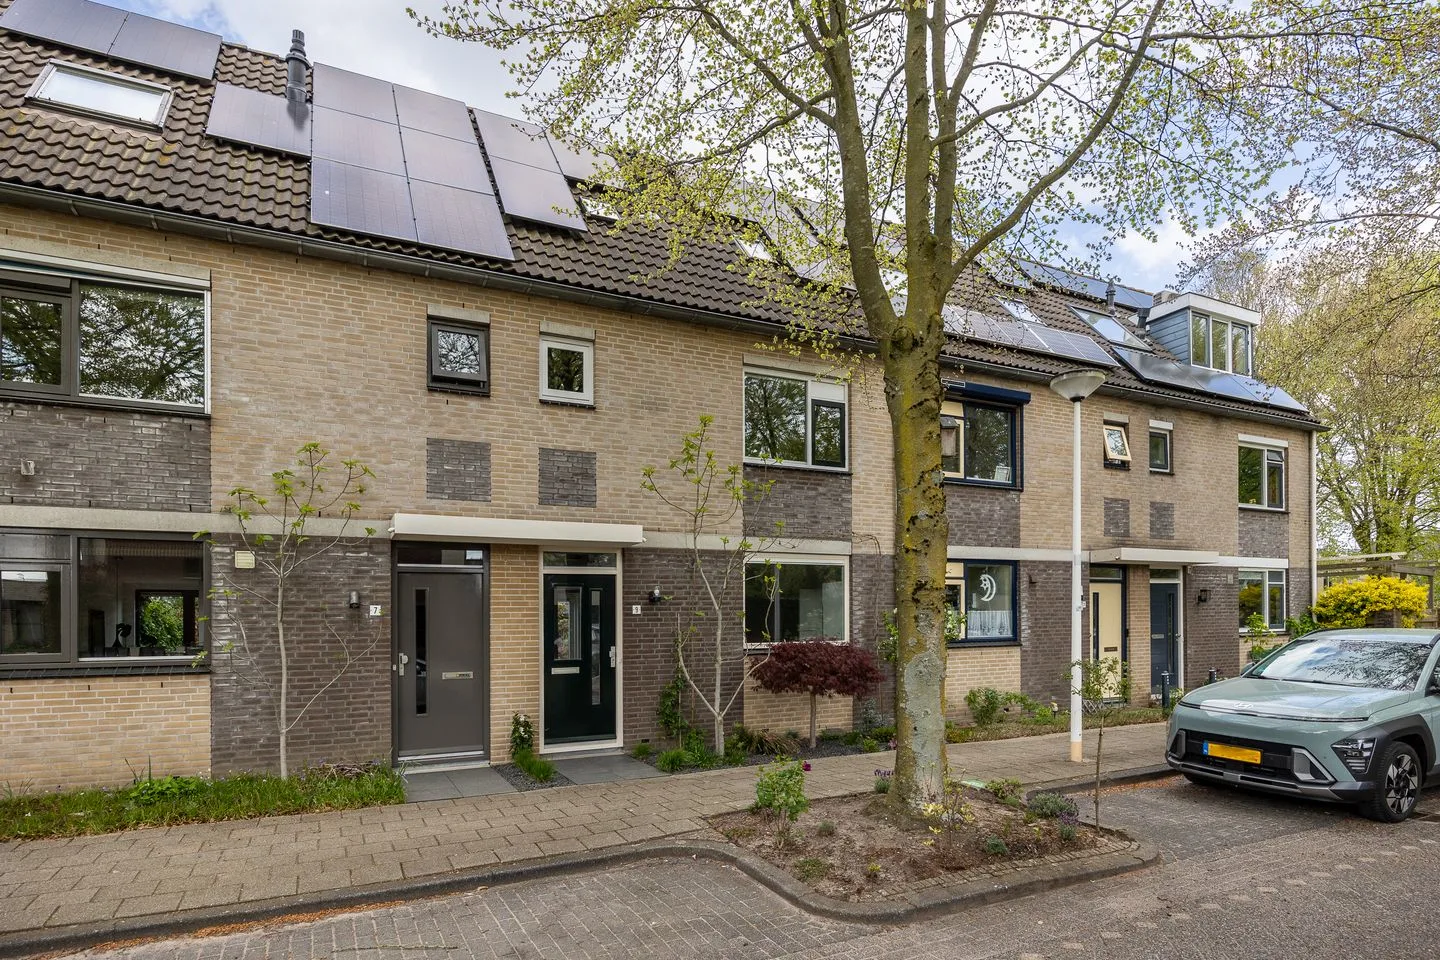
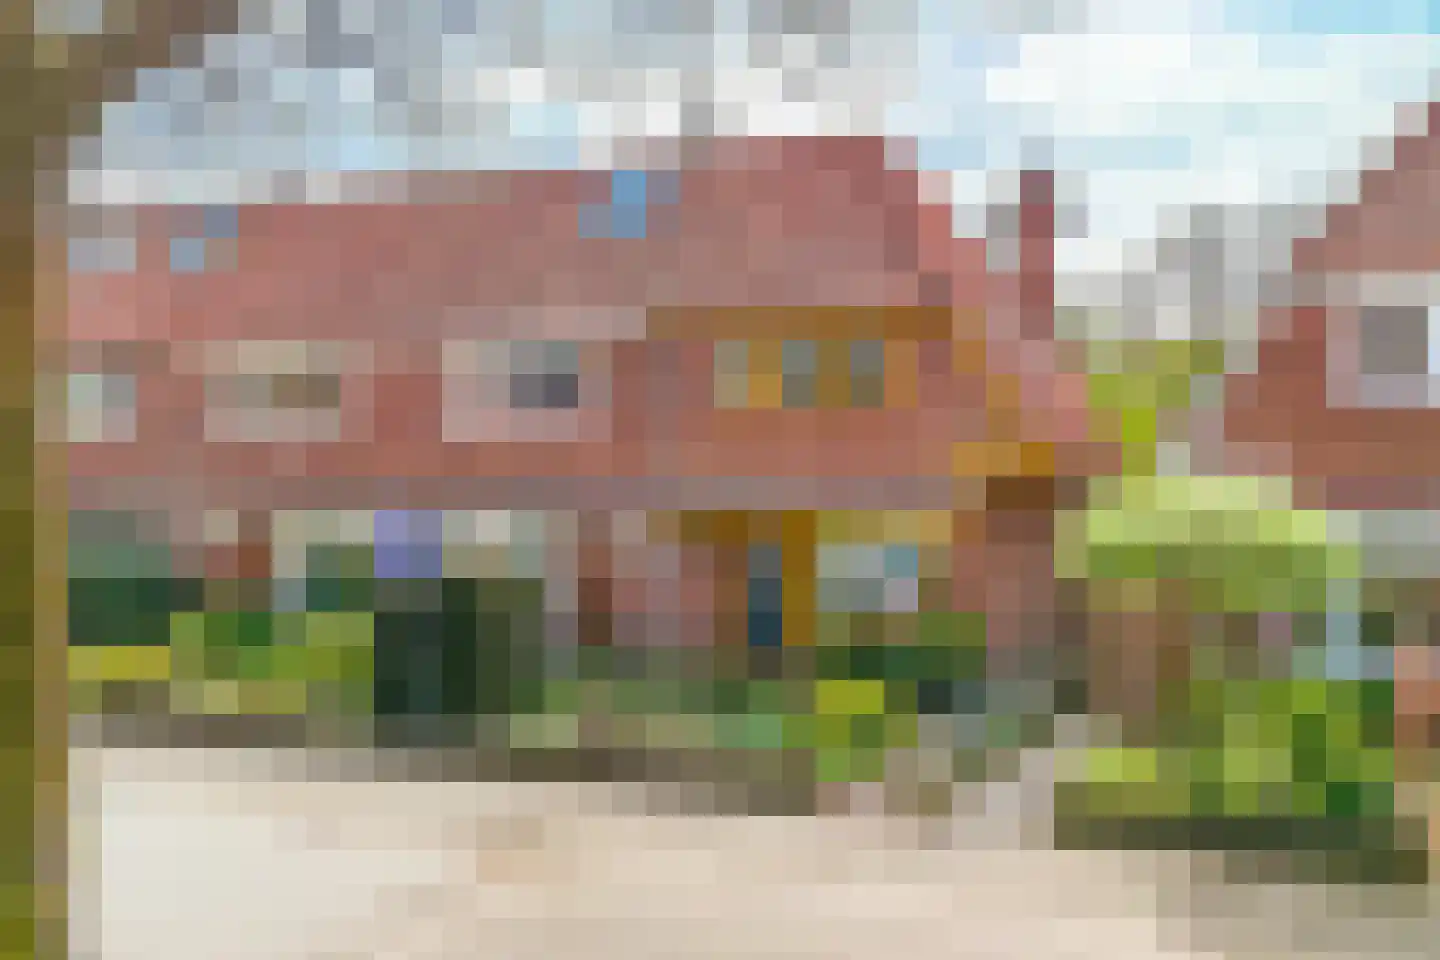
Nepveulaan 68
3705LE Zeist
€ 565.000 k.k.
GSave as favorite- Living area
- 88 m²
- Land area
- 264 m²
- Bedrooms
- 3
-
- Available
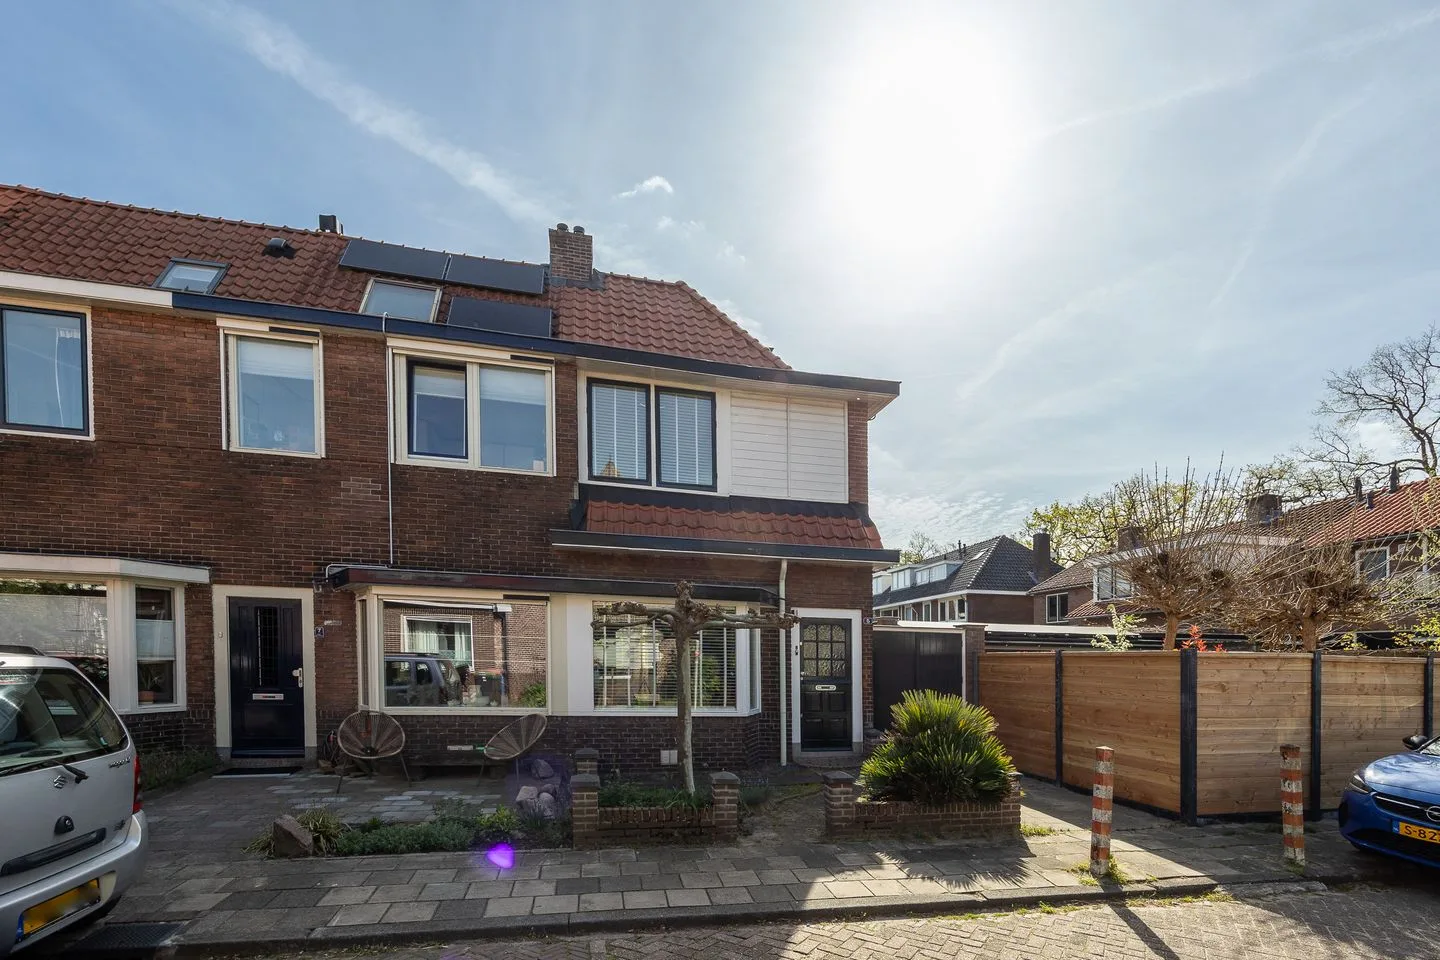
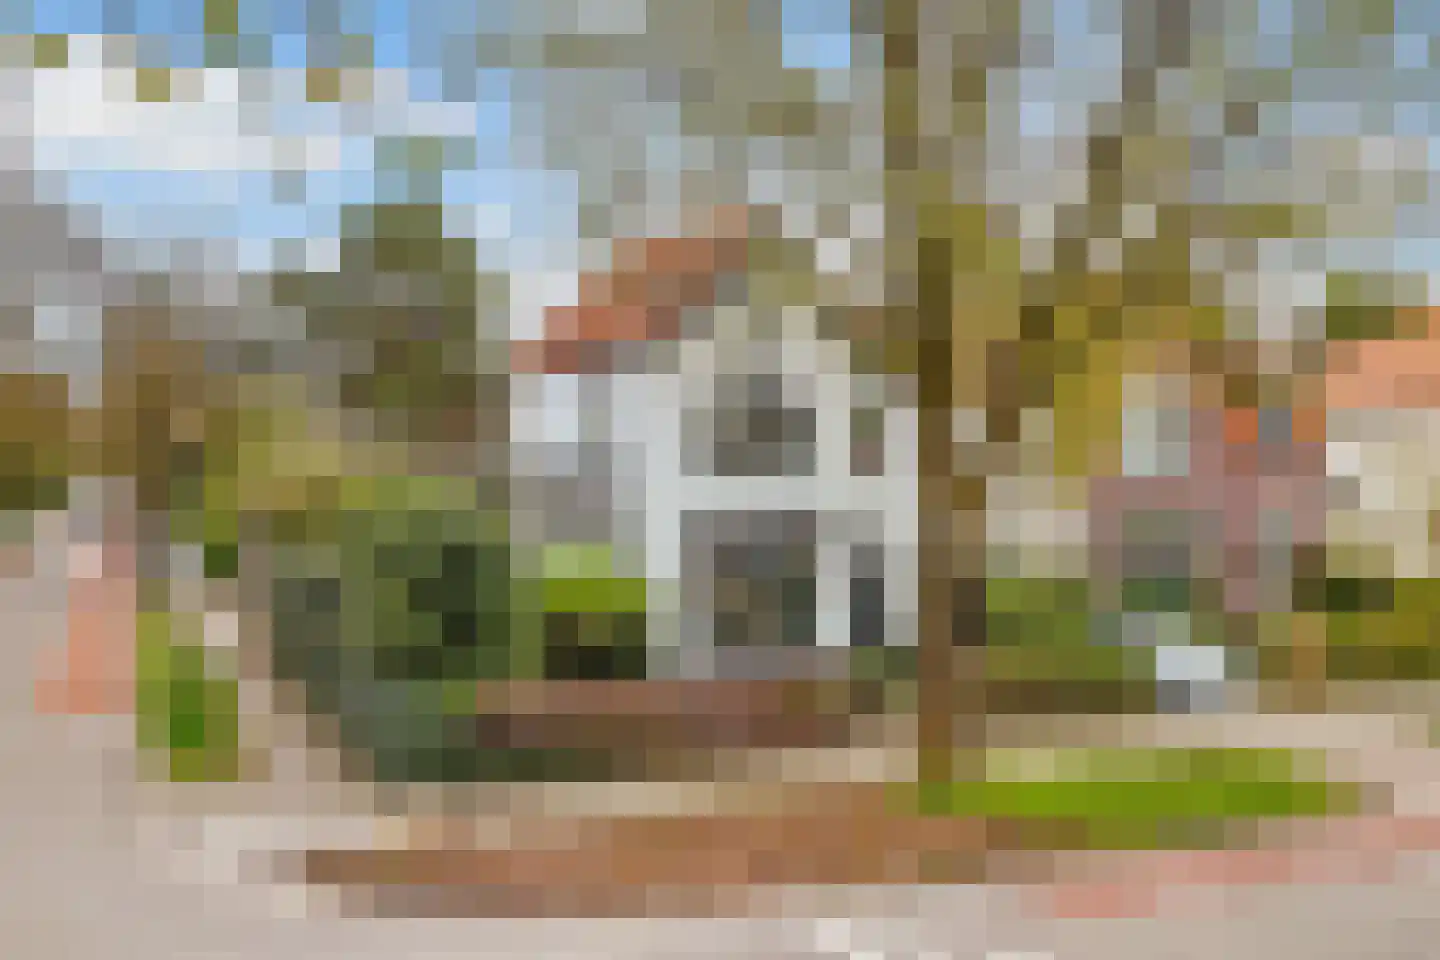
Bergweg 82
3707AD Zeist
€ 1.075.000 k.k.
€ 6.804/m²
FSave as favorite- Living area
- 158 m²
- Land area
- 396 m²
- Bedrooms
- 4
-

- Available
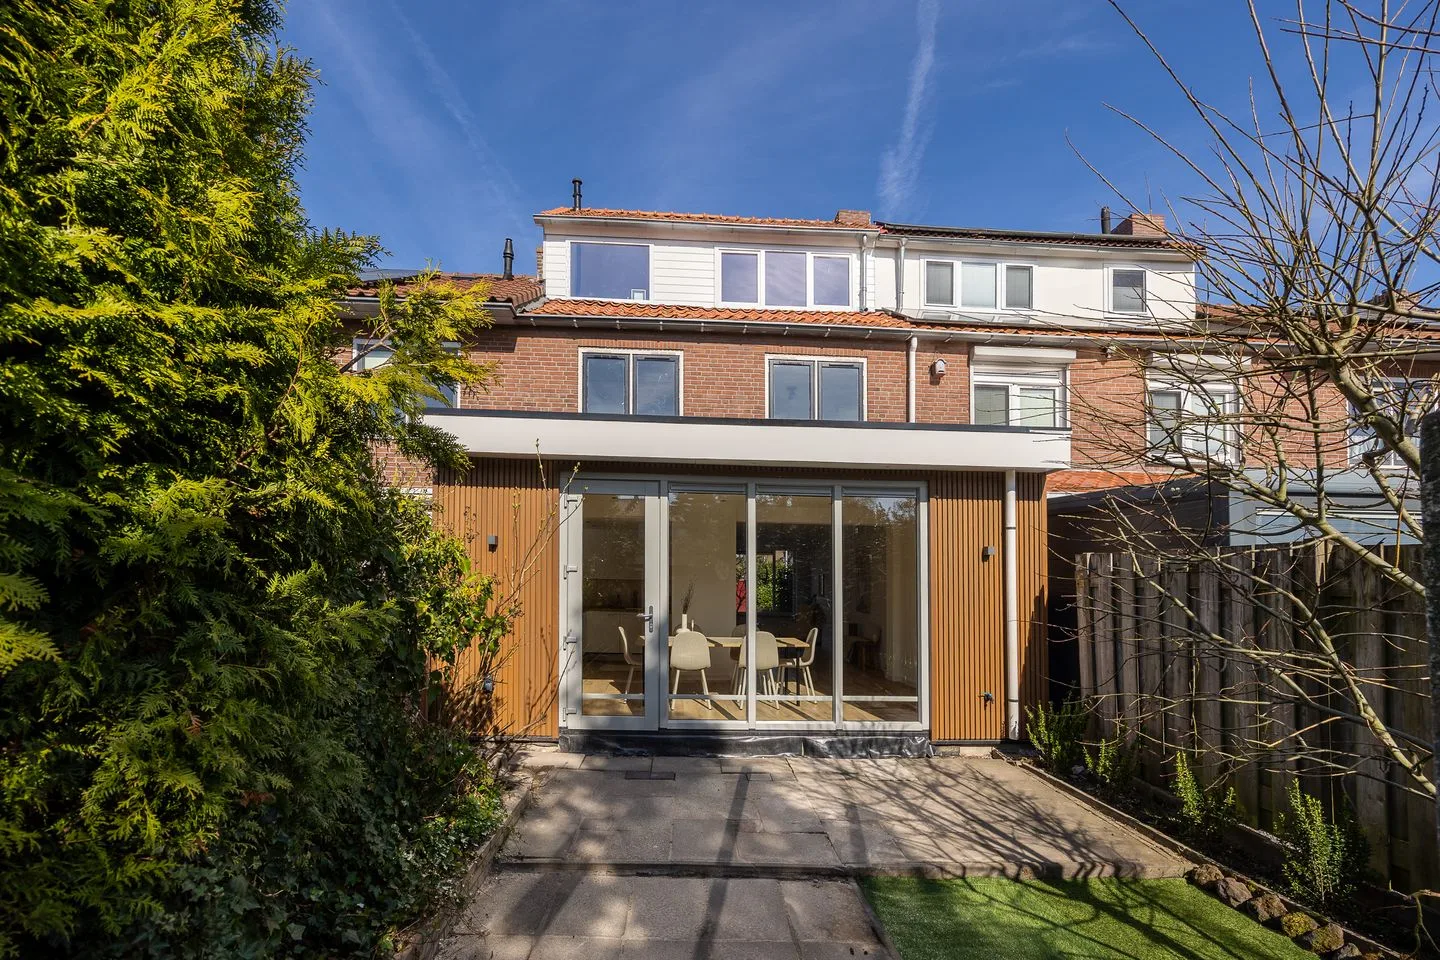
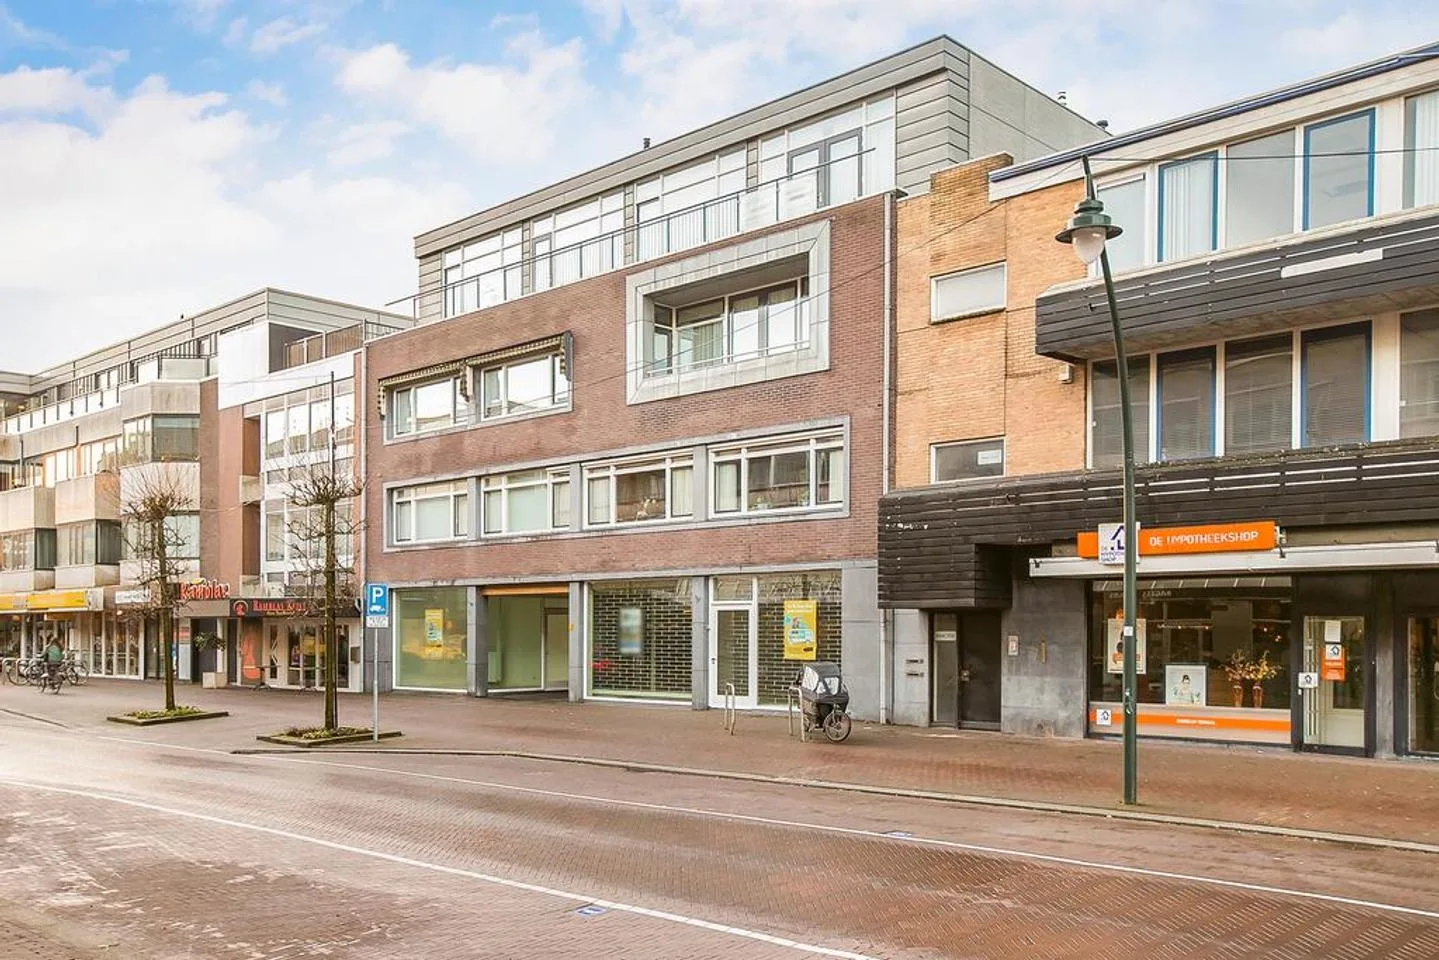
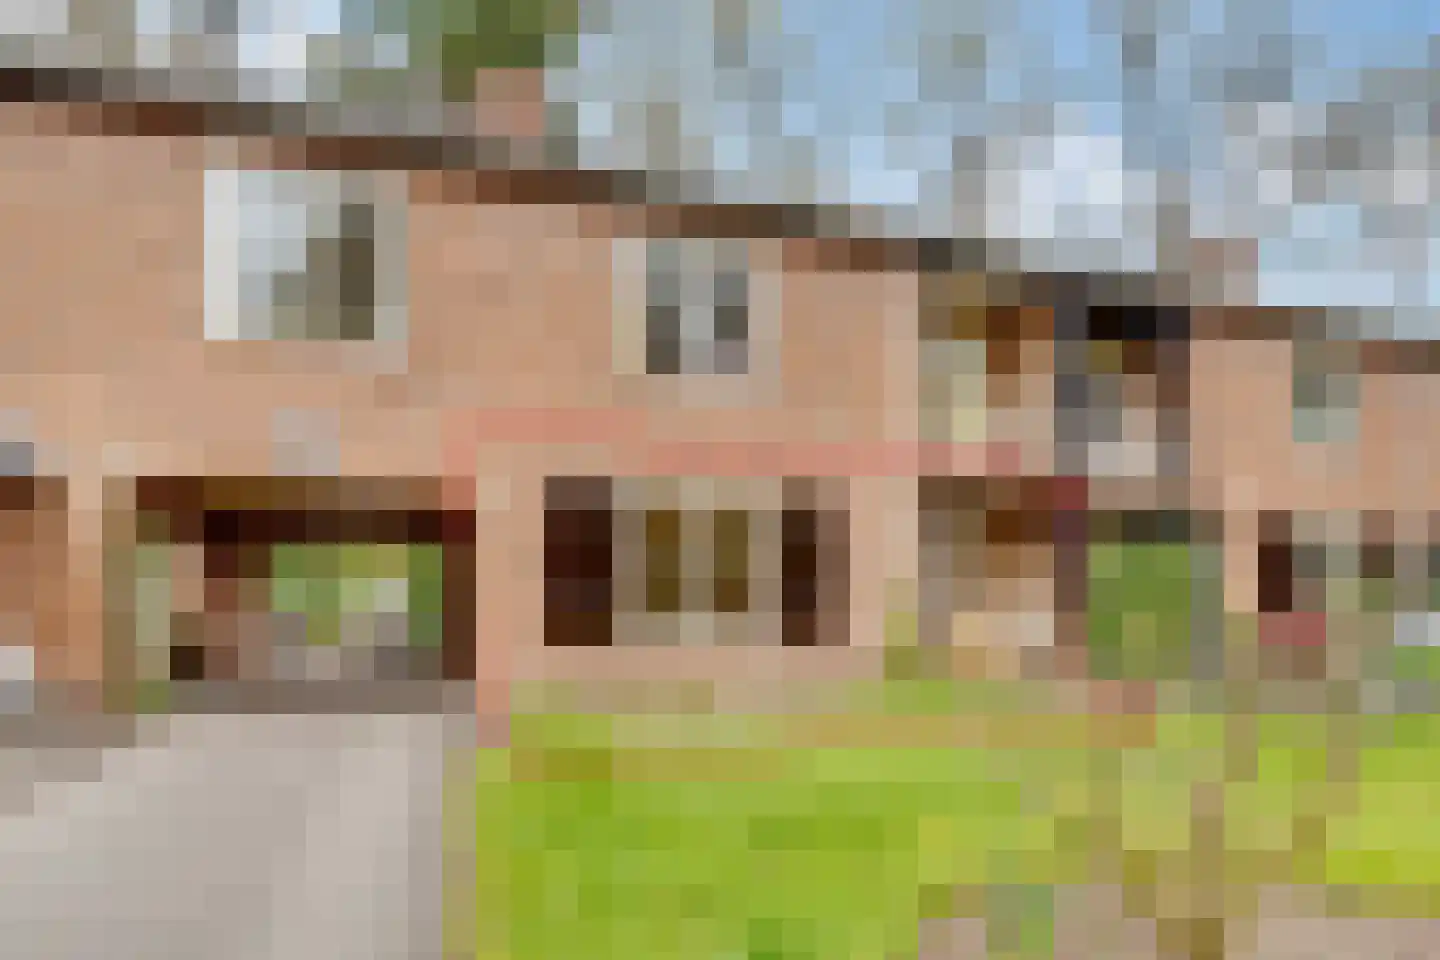
Fornheselaan 2 D
3734GC Den Dolder
€ 695.000 k.k.
€ 5.940/m²
ASave as favorite- Living area
- 117 m²
- Land area
- —
- Bedrooms
- 2
-
- Available
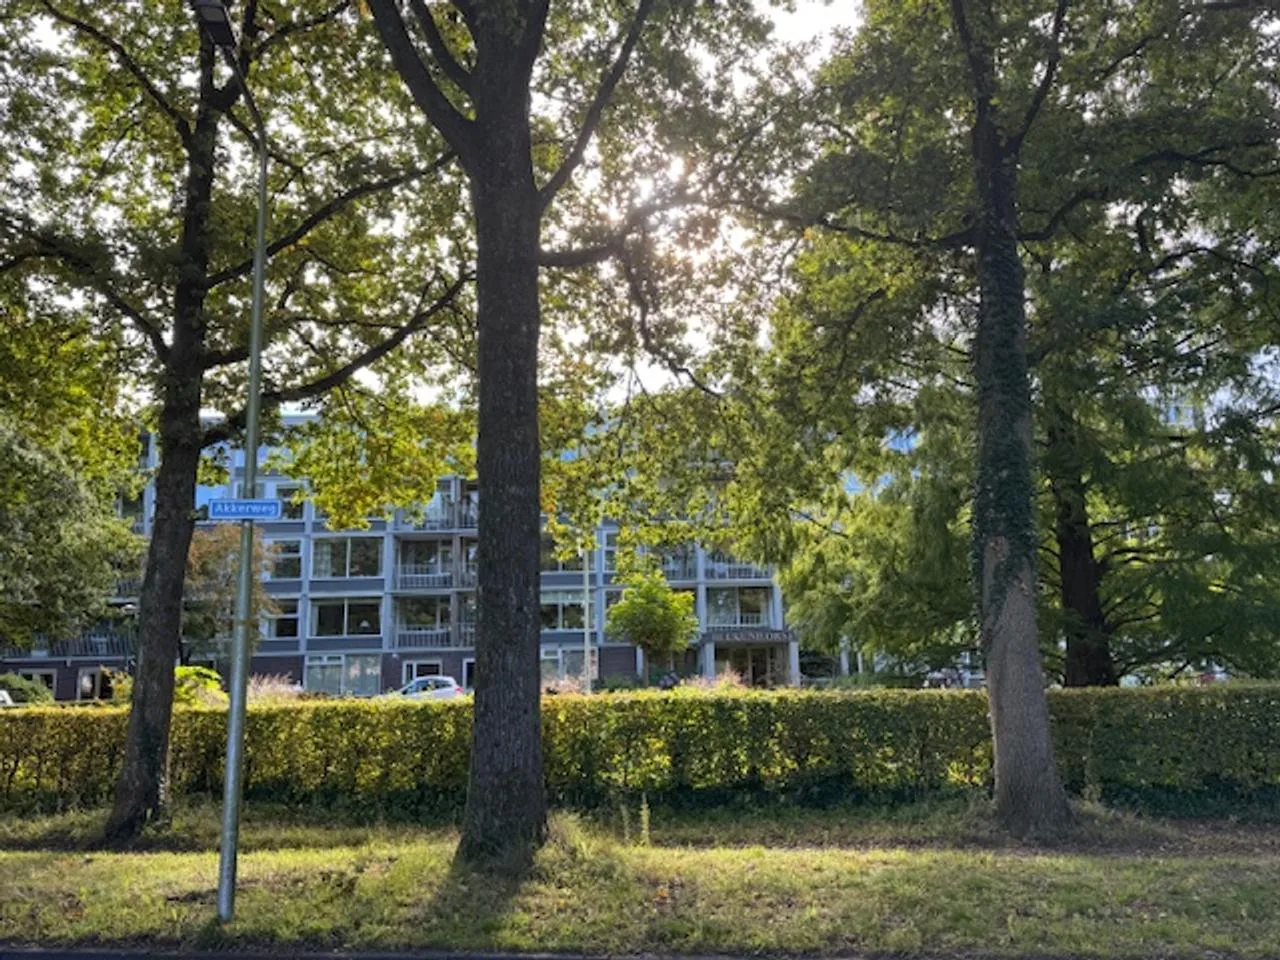
Park Rodichem 17
3712CA Huis ter Heide
€ 190.000 k.k.
€ 4.130/m²
Save as favorite- Living area
- 46 m²
- Land area
- —
- Bedrooms
- 1
-

- Under consideration
Acacialaan 24
3707EV Zeist
€ 1.750.000 k.k.
€ 5.912/m²
CSave as favorite- Living area
- 296 m²
- Land area
- 770 m²
- Bedrooms
- 5
Reviews (42)
Review platforms
BronscoresTotal score
42 total reviews

Funda
34 reviews on Funda

8 reviews on Google
-
Paltzerweg 131 A
10Translated by AIThe contact was very good. Mr 'tHart was alert, gave good advice, technically he was competent. His explanation was always clear and bright. He also always took plenty of time for us. This real estate agent is highly recommended!
-
Voorheuvel 129
10Translated by AIGood contact, they open a group app where everyone is in. Super handy! Further I have already bought multiple houses with them, both for sale and purchase. Always good. Not the cheapest but I am very satisfied.
-
Dr. Stärckelaan 20
9Translated by AIYou build a fantastic relationship with this real estate agent. They are very friendly and have good knowledge of pockets. They have helped us very well.
-
Kruisbeklaan 13
10Translated by AIExceptionally pleasant contact. Quick response to questions. In short, the perfect real estate agent for the Bilthoven area!
-
Geiserlaan 4
10Translated by AIThe contact went very well. We were well guided and advised. We would also like to thank the real estate agent.
-
Kometenlaan 30
9Translated by AIA very nice, thoughtful real estate agent. No chasing but genuine cooperation so that you find your perfect spot. And also for selling the house they arrange everything for you and keep you well informed.
-
Fornheselaan 66
10Translated by AIA lot of expertise and market knowledge, personal, helpful, friendly, short lines, in short, we are very satisfied and we wholeheartedly recommend Peter and Noud.
-
Ruysdaellaan 69
10Translated by AIWhat a relief to work with an extremely knowledgeable, experienced, and above all reliable broker who transparently discusses everything with you before taking action. And also works with an exceptionally good photographer. Really very nice.
-
Park Rodichem 101
9Translated by AICustomer service oriented. Questions were asked and answered thoroughly, both requested and unsolicited. The real estate agent was very easy to reach.
-
Hertenlaan 25 D
10Translated by AINoud is the best kind of broker you can imagine. He's an incredibly nice person, thinks along in all scenarios, is flexible, has a lot of expertise and market knowledge, is enormously experienced, and is also a very good negotiator. I’ve known him for 20 years and have worked with him on multiple transactions. Highly recommended.
-
Marterlaan 3
9Translated by AIExcellent. Very pleasant, no pressure, well-considered, taking into account all parties.
-
Ruysdaellaan 45
10Translated by AIGood communication, appointments are kept, understanding of affairs. Accessible and there is always time to answer questions.
-
Jozef Israëlslaan 7
10Translated by AIVery satisfied! Always good consultation and a correct and transparent way of working! Good knowledge of the market.
-
Prins Hendriklaan 36
8Translated by AIPleasant and easily accessible realtor. I was informed after each action. Approachable and all questions were answered pleasantly and quickly.
-
Kastanjelaan 9
10Translated by AIPerfect guidance throughout the sale process. Via the App, we were constantly kept informed about the progress of the viewings. A surprise that the sale was realized in 14 days. We are very satisfied with the real estate agents of Parkland.
-
Prof. Lorentzlaan 123
10Translated by AICareful and reliable, they take the time for both us and sellers as well as potential buyers. This ensures that the overall sales process runs smoothly and fairly. Pleasant, efficient communication and beautiful presentation. Highly recommended!
-
Hezer Enghweg 61
9Translated by AIVery pleasant, expert, adequate, also the help with the photoshoot, guidance of potential buyers.
-
Marnixlaan 53
10Translated by AII am enormously satisfied with Parkland Makelaars. Not only because of their knowledge, insights and valuable advice, but also because of their personal approach to both the seller and every interested party! They ensure that every detail is correct and then take the time for each viewer to get to know the house well. There is (in contrast to many Utrecht estate agents) no direct pressure to submit an offer. Communication and planning were also perfectly clear. In short, e...
-
Bremlaan 16
10Translated by AIStep by step with good advice, expertise and guidance all the way to the handover. Very nice!
-
Egelinglaan 45
10Translated by AIVery satisfied. Noud 't Hart is a very skilled professional. Personal, honest and efficient. Feeling seen in our wishes.