Residents
31.694
Last year: 2026
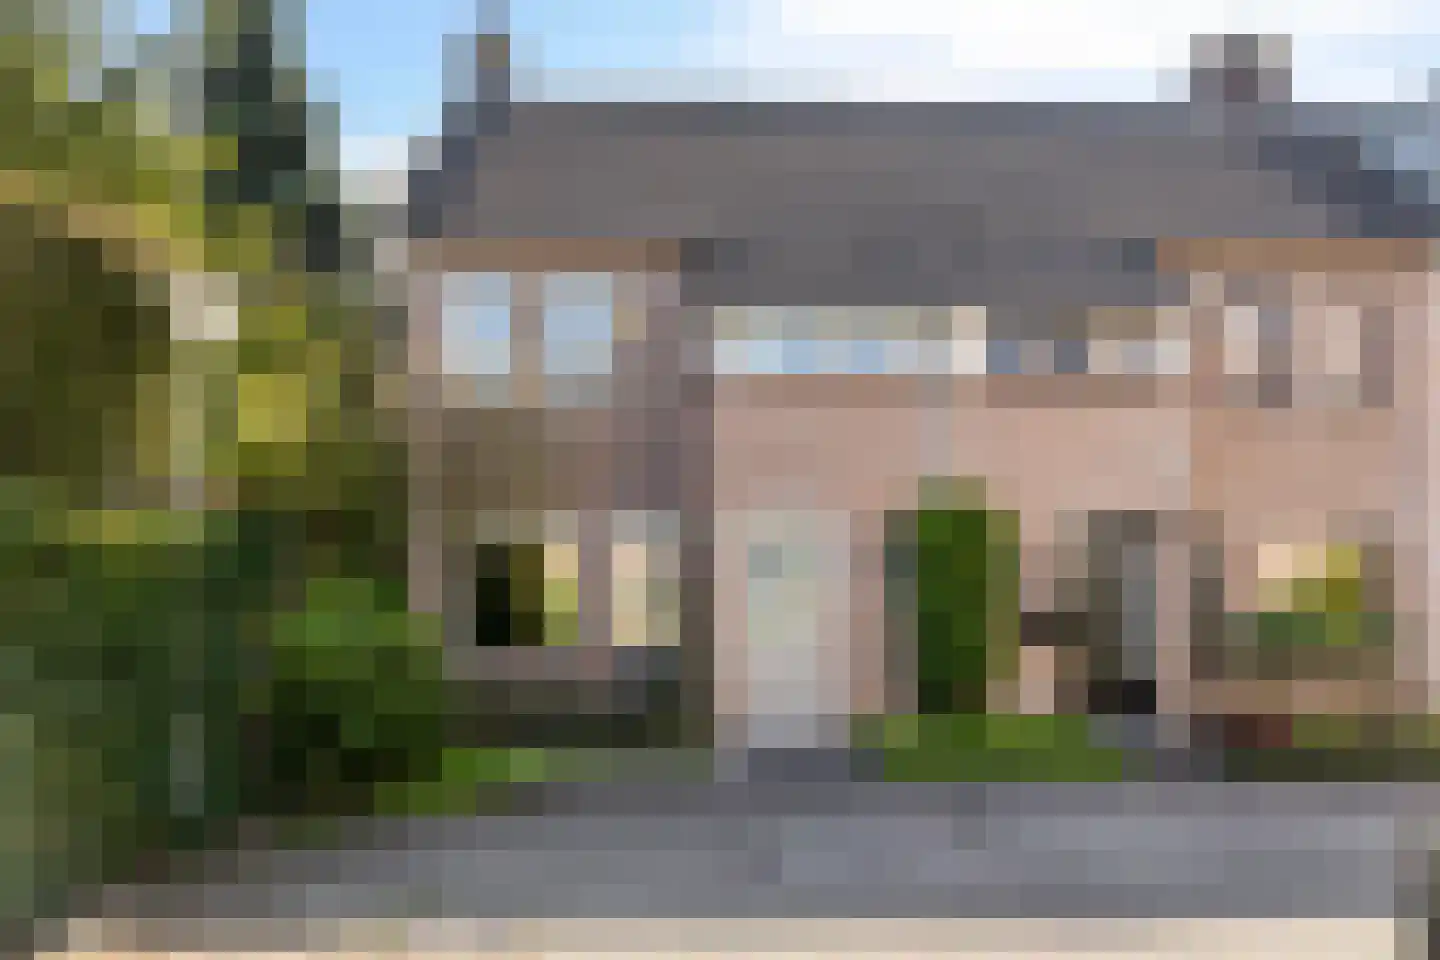
5683MT Best • Noord-Brabant
€ 475.000 k.k.
Cost of copper (estimated): € 11.350
2% transfer tax (€ 9.500) + notary (€ 1.150) + valuation (€ 700)
Total incl. VAT: € 486.350
Purchase price /m²: € 3.770
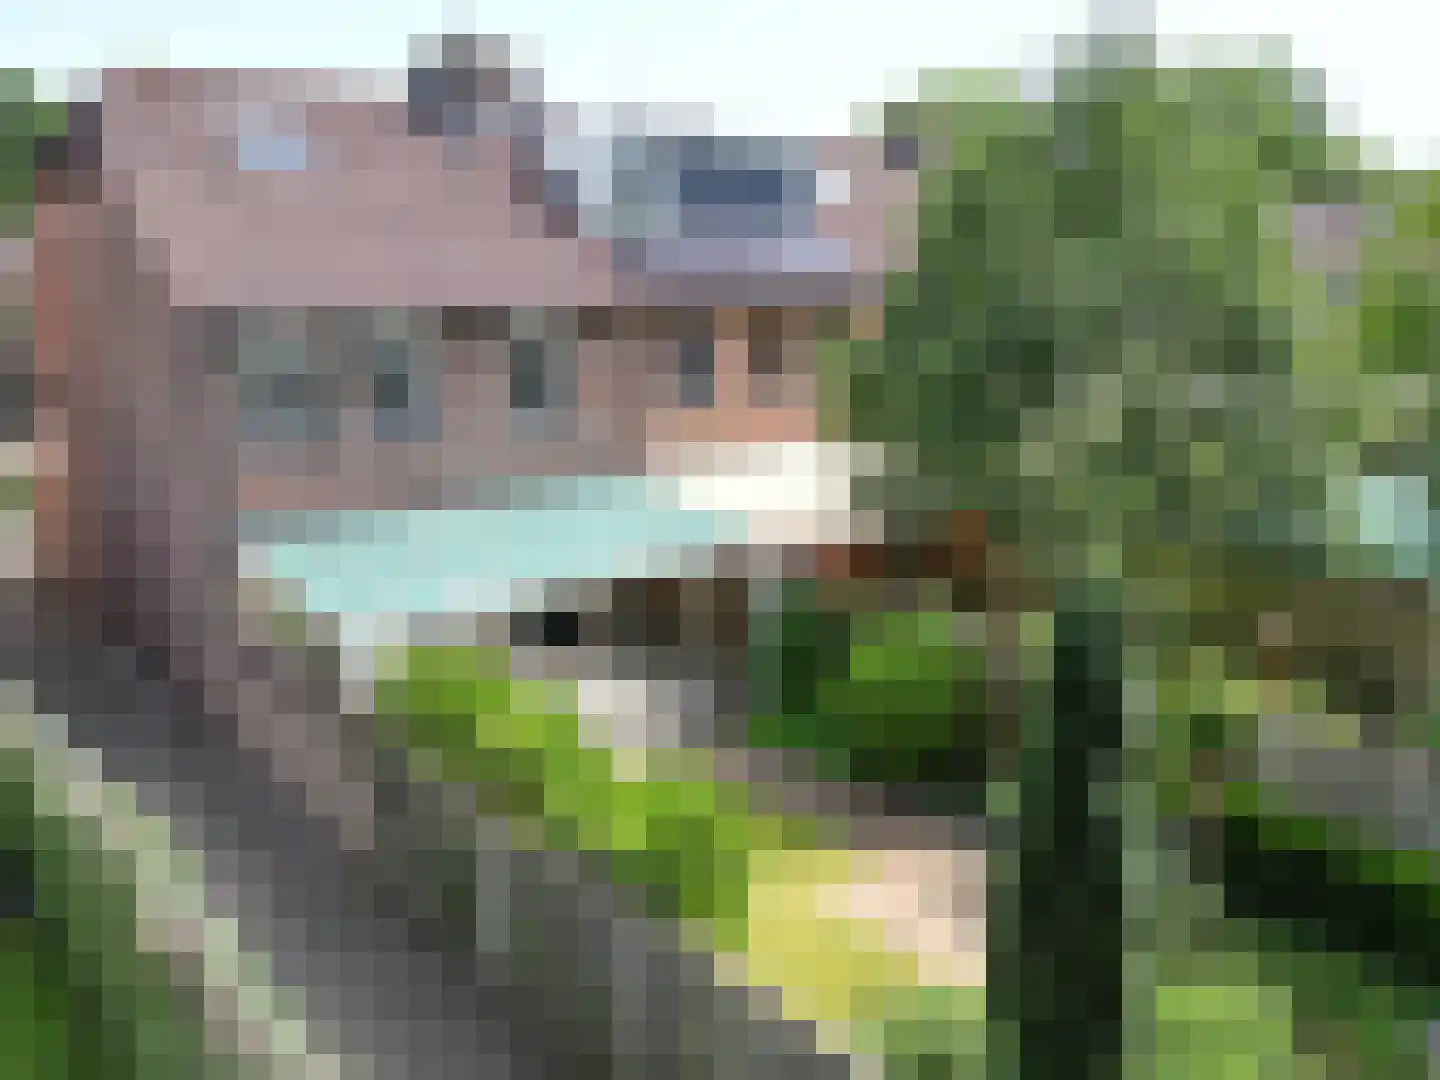
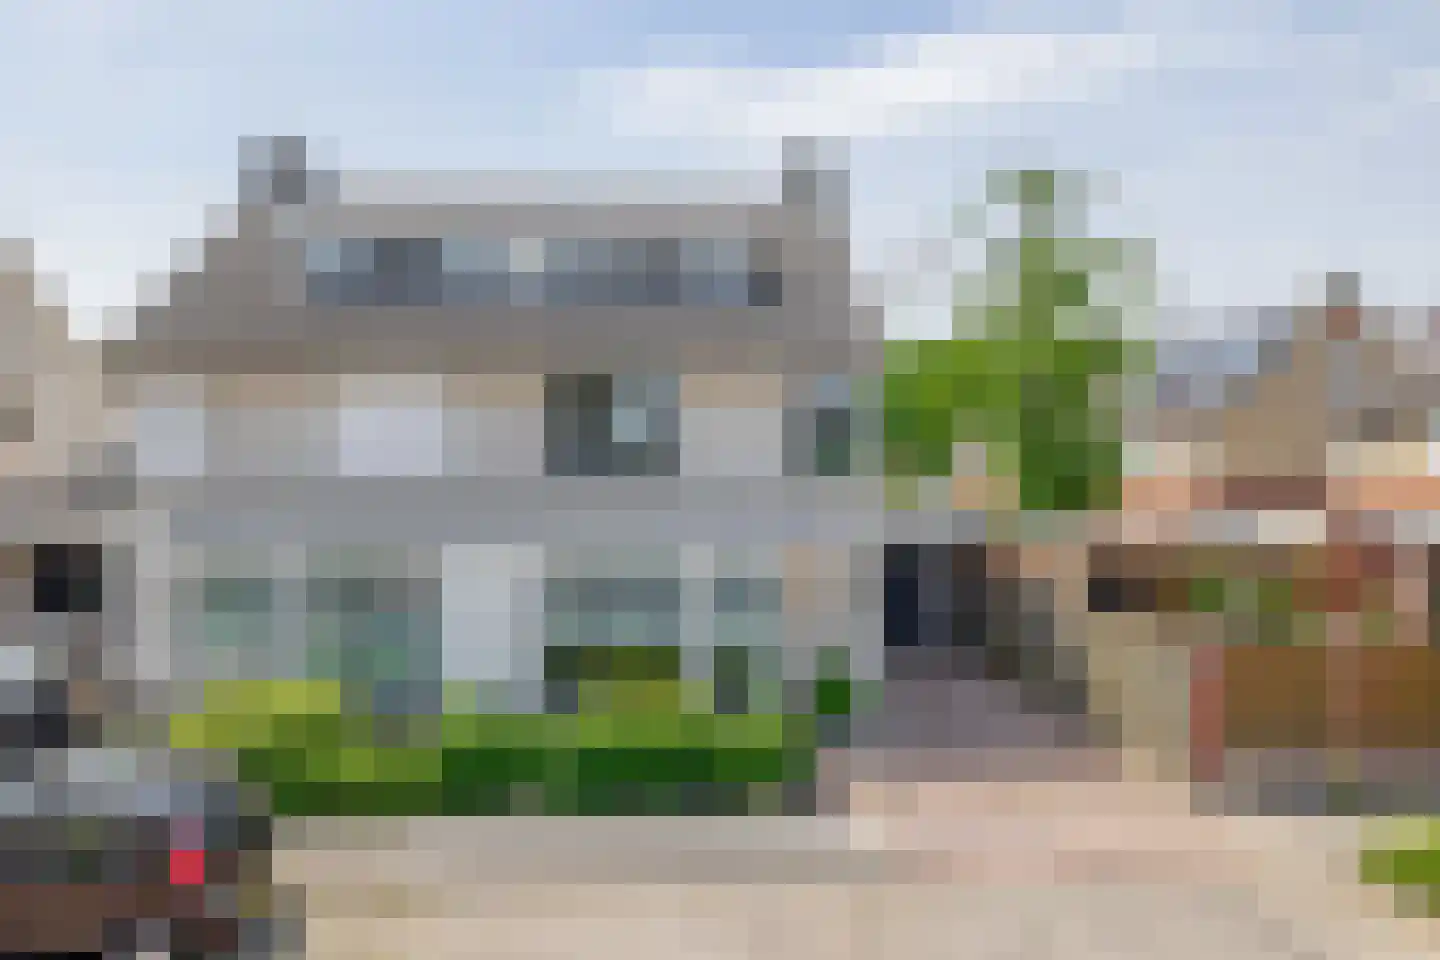
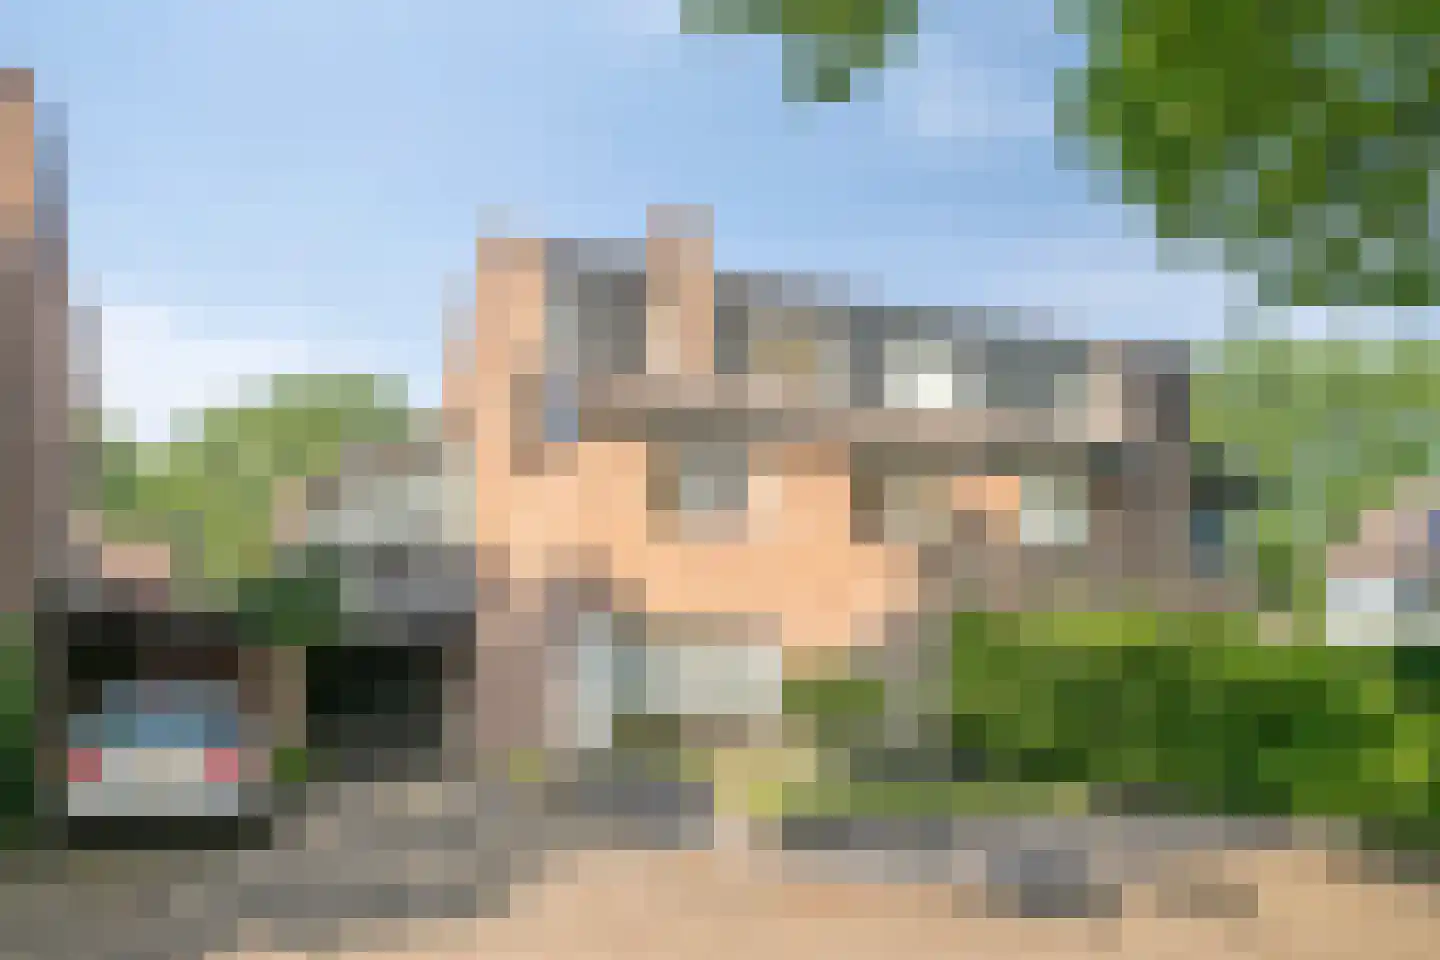
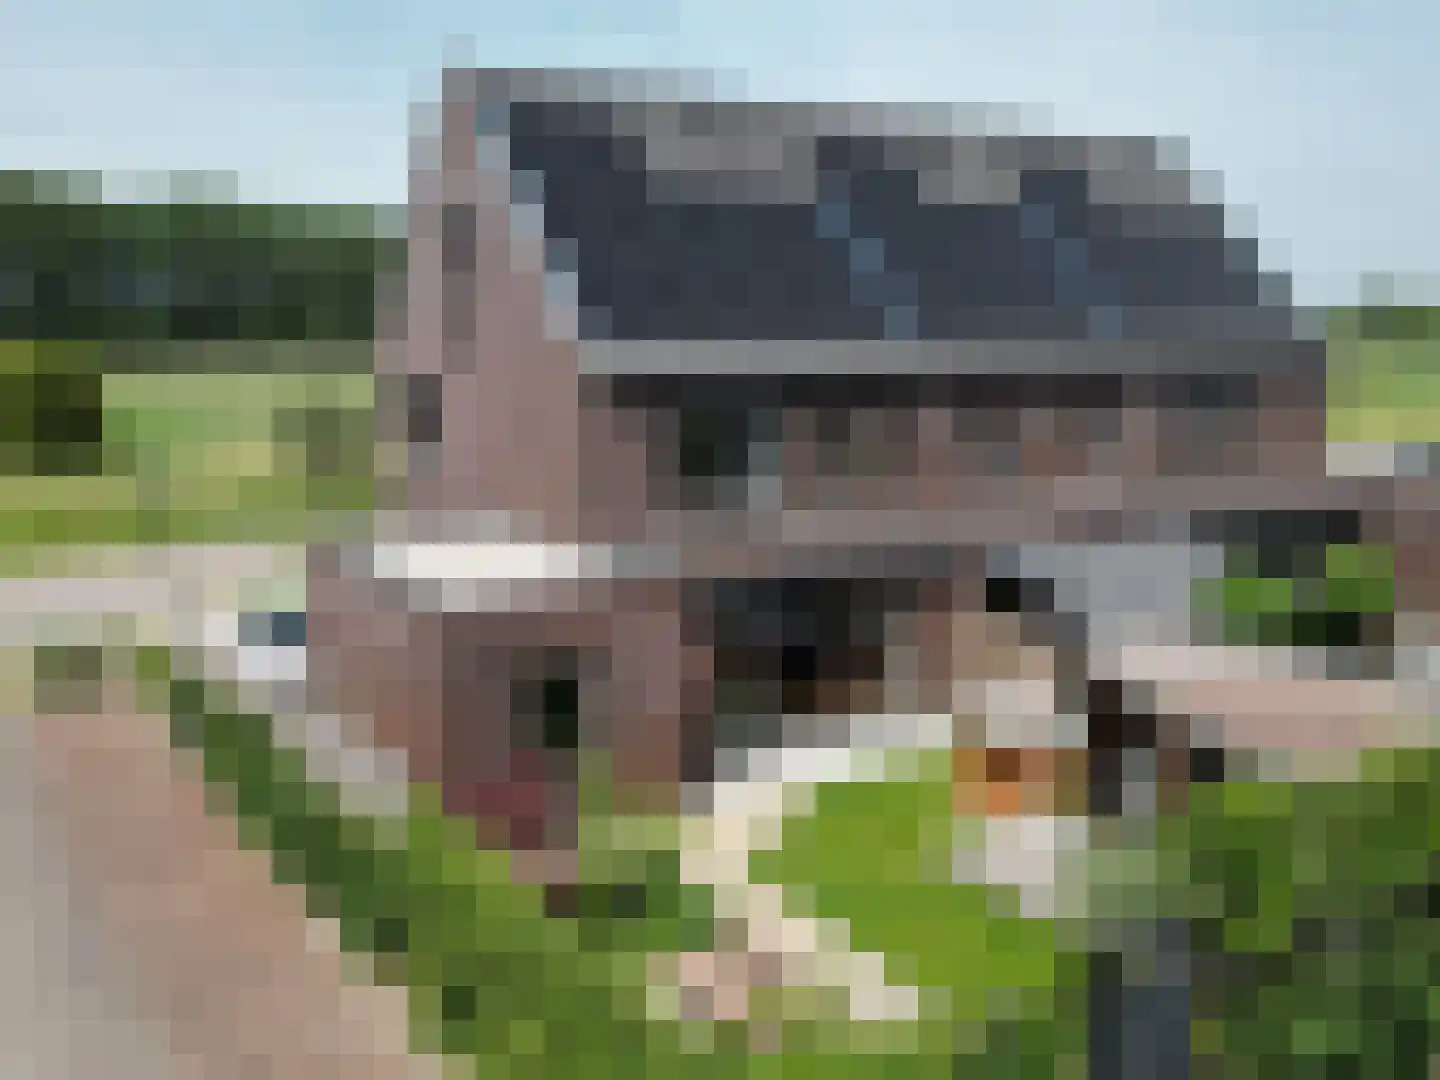
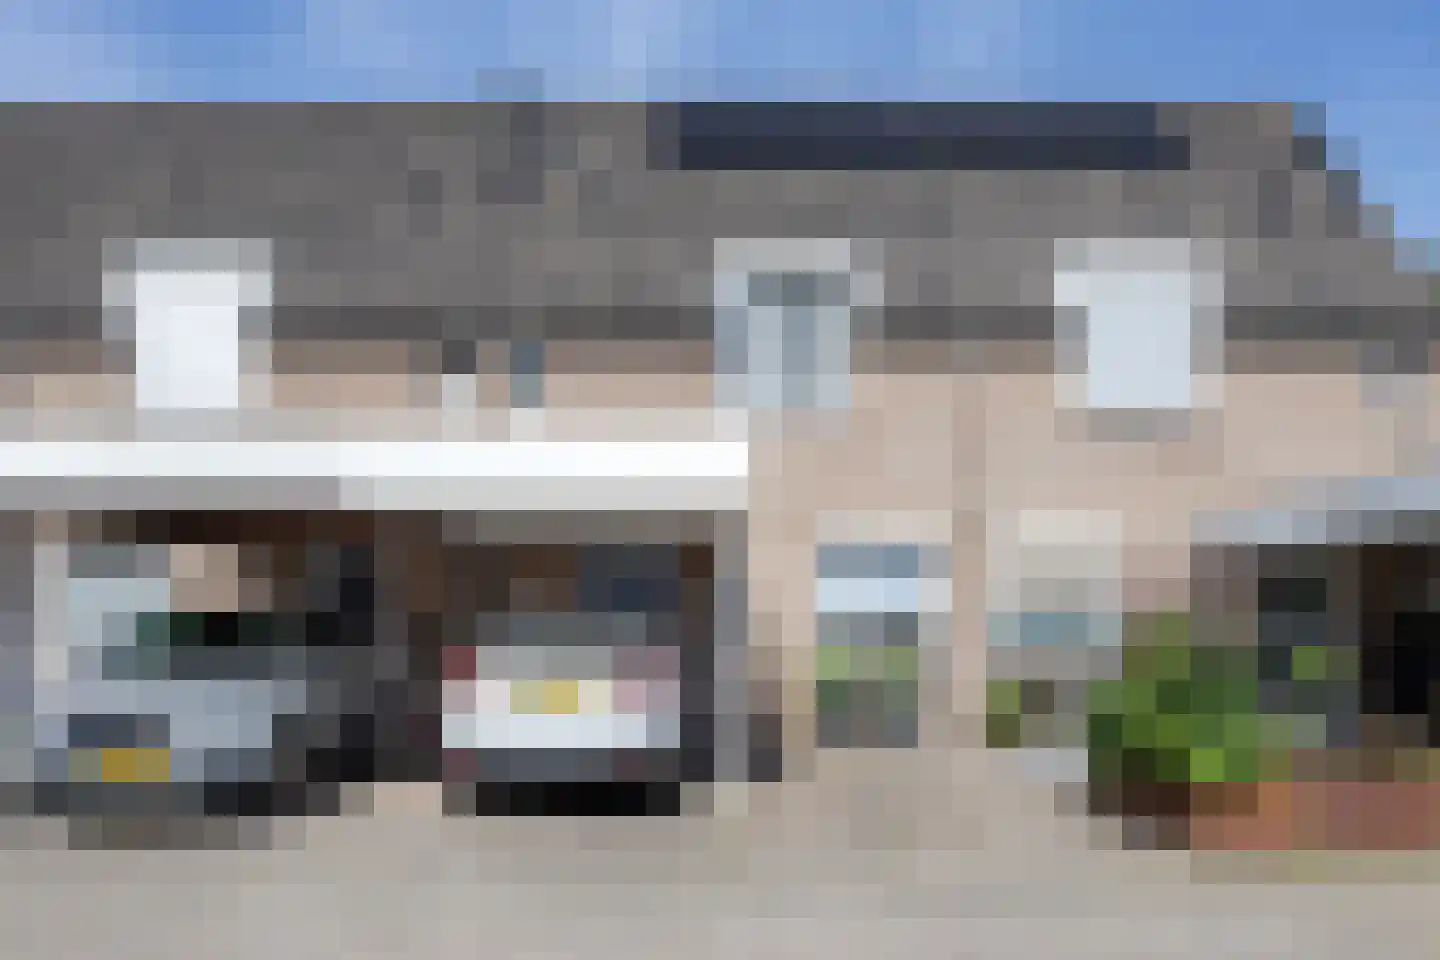
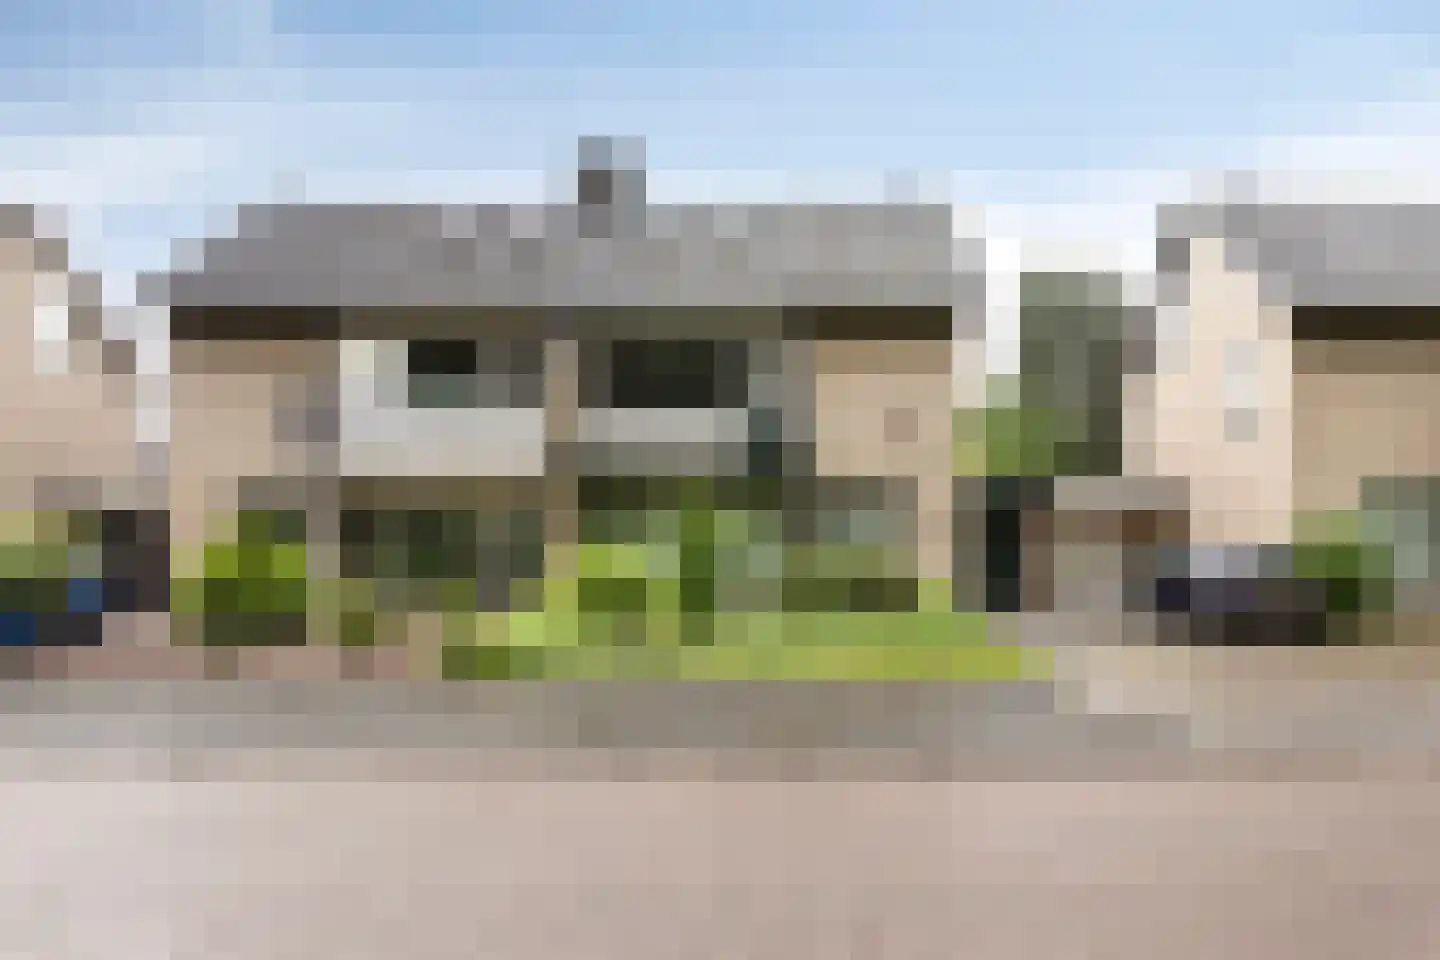
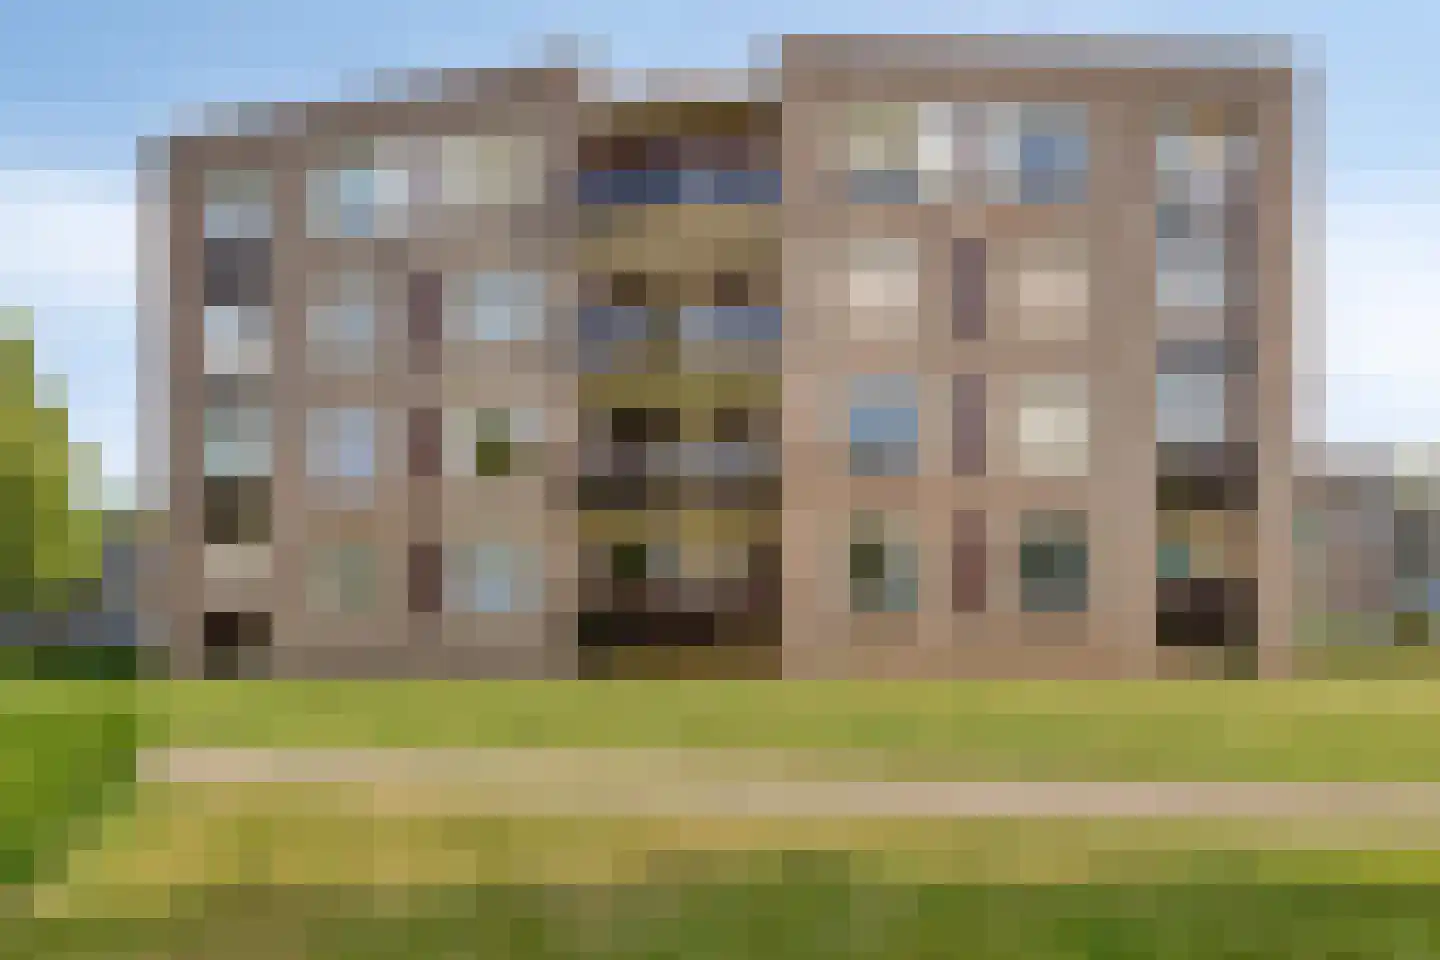
Wagenmaker 1 in Best is een keurig onderhouden eindwoning van 126 m² op een grondstuk van 183 m², gelegen in de rustige wijk 'De Leeuwerik', nabij het centrum en alle dagelijkse voorzieningen. De woning heeft vier slaapkamers, een moderne badkamer uit 2014 en een ruime zolder kamer. Het huis is volledig met energiebesparend toestellen opgeknapt: in 2022 zijn 9 zonnepanelen geplaatst en de meterkast en CV ketel vernieuwd, plus in 2024 het toilet aan de begane grond. De woning biedt een 17-meter diepe, zuidgerichte achtertuin met terras en berging, verbonden met een garage met elektra. Het interieur is comfortabel ingericht met houten vloeren in woonkamer en keuken, moderne keukentechniek en sfeervolle houthaard, complementeert door een lichte doorzon woonkamer op de begane grond.
€ 475.000
Cost of copper (estimated): € 11.350
2% transfer tax (€ 9.500) + notary (€ 1.150) + valuation (€ 700)
Total purchase (incl. p.p.): € 486.350
3,21%
Yearly
€ 23.750
Direct available
Estimated mortgage
Indicative gross monthly cost
Based on annuity and 30 year term
Indicative net monthly cost
iDisclaimer: this mortgage calculation is a simplified indication based on general assumptions. No rights can be derived from the results shown. Calculated with 10-annual interest (zonder NHG), automatically determined based on the price limit € 470.000. Source: 10-jaars rente uit mortgage_rates (08-06-2026 03:45). For non-NHG, an 80% mortgage of the market value has been used in this indication.
Inloopdouche, ligbad, toilet, wastafel, en wastafelmeubel
Elektrische deur en elektra
Discover where agents are active in Best
View current location data on residents, WOZ development, housing stock, energy consumption, business activity and safety in Best. In 2026 were there 31.694 residents. The average WOZ value in 2025 is EUR 464.000.
Residents
31.694
Last year: 2026
Average WOZ
EUR 464.000
Last year: 2025
Average income per person.
EUR 37.200
Source: AllNumbers
Crimes (current year)
1.240
Total registered
| Year | Residents |
|---|---|
| 2022 | 30.608 |
| 2023 | 30.897 |
| 2024 | 31.223 |
| 2025 | 31.652 |
| 2026 | 31.694 |
| Year | Average WOZ |
|---|---|
| 2021 | EUR 321.000 |
| 2022 | EUR 359.000 |
| 2023 | EUR 403.000 |
| 2024 | EUR 431.000 |
| 2025 | EUR 464.000 |
Hoger
38
Praktisch
22
Middelbaar
39
Europa
2.888
Nederland
24.386
Buiten Europa
4.378
Label A
3.807
Label C
3.631
Label B
3.027
Label D
852
Label E
828
Label F
606
Label A+++
585
Label A++++
481
Label G
349
Label A+
274
Label A++
118
Label A+++++
5
| Year | Gas (m3) | Electricity (kWh) |
|---|---|---|
| 2020 | 1.250 | 3.170 |
| 2021 | 1.370 | 3.200 |
| 2022 | 1.060 | 2.980 |
| 2023 | 890 | 2.840 |
| 2024 | 860 | 2.940 |
Hoekwoning
Gas: 940 • Electricity: 2.930
Huurwoning
Gas: 700 • Electricity: 2.140
Koopwoning
Gas: 970 • Electricity: 3.130
Appartement
Gas: 560 • Electricity: 1.870
Tussenwoning
Gas: 830 • Electricity: 2.690
Vrijstaande woning
Gas: 1.410 • Electricity: 4.350
Twee-onder-één-kap woning
Gas: 1.080 • Electricity: 3.330
Total number of company establishments: 4.005
| Period | Crimes |
|---|---|
| jan 2025 | 83 |
| jan 2026 | 120 |
| jul 2025 | 113 |
| jun 2025 | 111 |
| mei 2025 | 118 |
| mrt 2025 | 87 |
| nov 2024 | 100 |
| nov 2025 | 102 |
| okt 2024 | 94 |
| okt 2025 | 105 |
| sep 2024 | 89 |
| sep 2025 | 109 |
These figures give an indicative picture of safety trends in the living environment of Best.
Short answers based on current local statistics, handy for a quick comparison of the living environment.
Best telt in 2026 ongeveer 31.694 inwoners.
De gemiddelde WOZ-waarde in Best is in 2025 circa € 464.000.
Het gemiddelde inkomen per inwoner in Best ligt rond € 37.200 per jaar.
Voor het huidige jaar gaat het om ongeveer 1.240 geregistreerde misdrijven. Gebruik deze cijfers als indicatie en vergelijk trends per periode.
In Best komt vooral "Tussenwoningen" veel voor, met ongeveer 5.709 woningen.
View more homes in this location.
5683LK Best
€ 525.000 k.k.
€ 4.375/m²
5685JP Best
€ 669.000 k.k.
€ 4.316/m²
5683LW Best
€ 700.000 k.k.
€ 4.217/m²
5684MA Best
€ 689.000 k.k.
€ 4.785/m²
5684JC Best
€ 445.000 k.k.
€ 3.870/m²
5683KJ Best
€ 550.000 k.k.
€ 3.595/m²
5683DN Best
€ 450.000 k.k.
€ 5.488/m²
5683EP Best
€ 415.000 k.k.
€ 4.278/m²
