Residents
12.060
Last year: 2025
2665SP Bleiswijk • Zuid-Holland
€ 500.000 k.k.
Cost of copper (estimated): € 11.850
2% transfer tax (€ 10.000) + notary (€ 1.150) + valuation (€ 700)
Total incl. VAT: € 511.850
Purchase price /m²: € 4.587
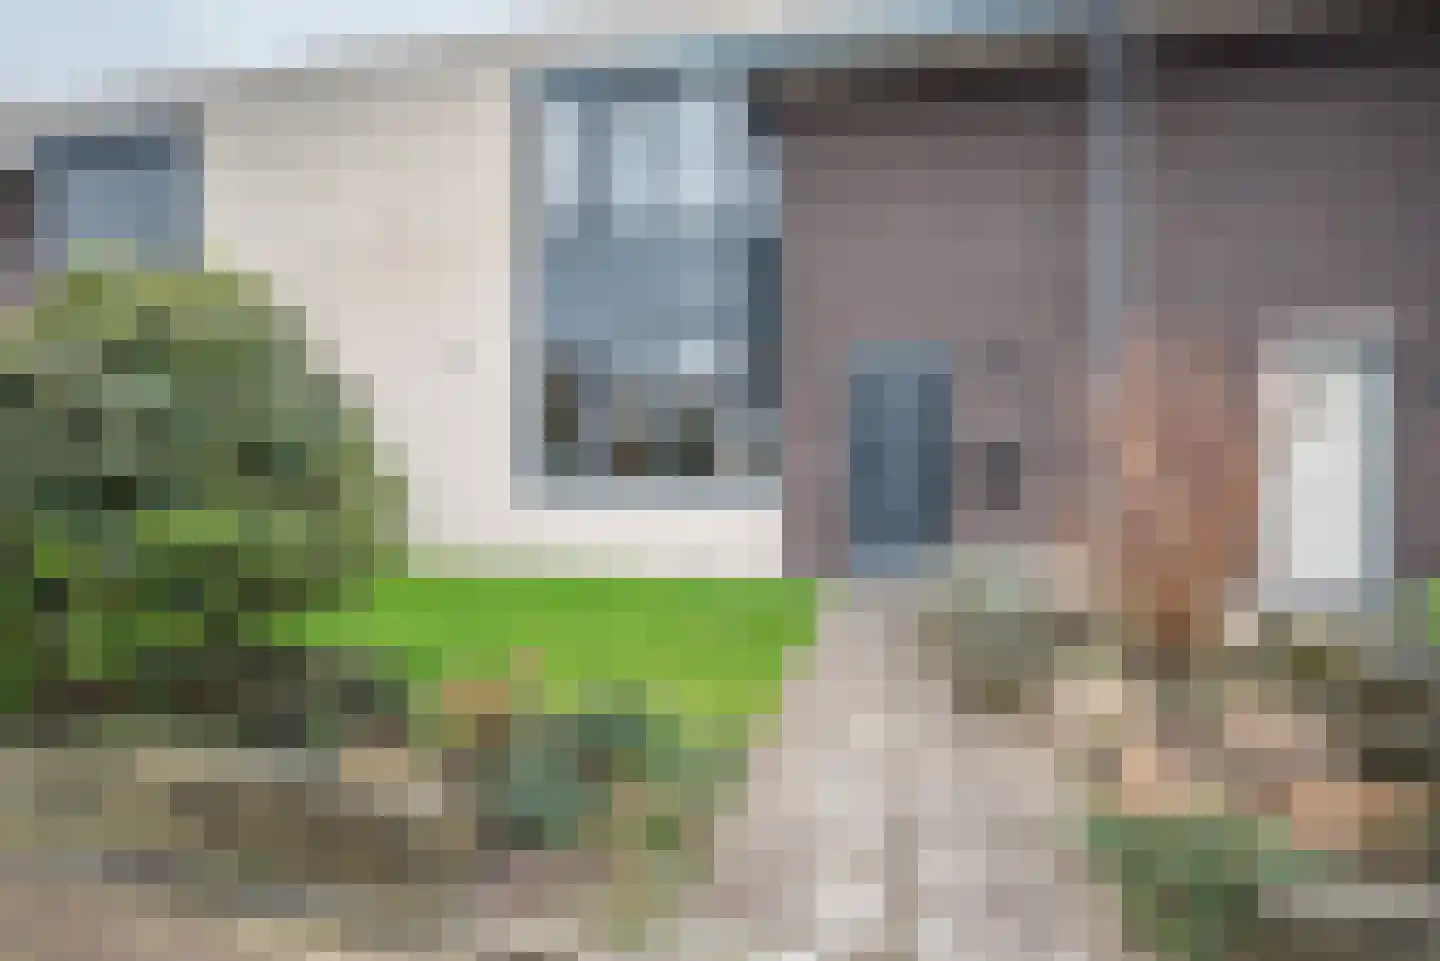
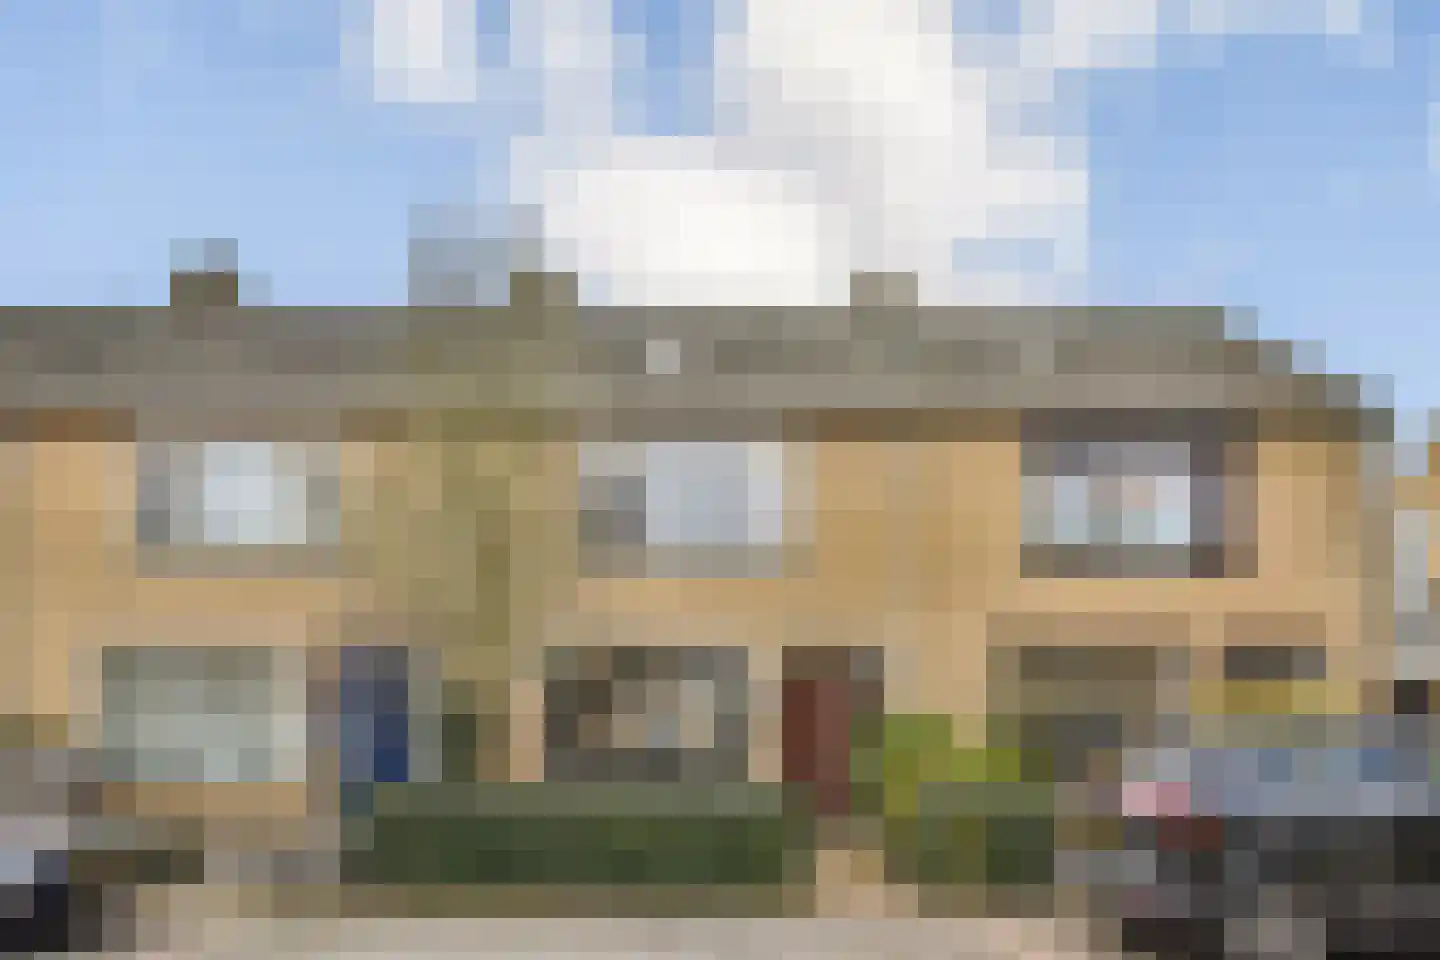
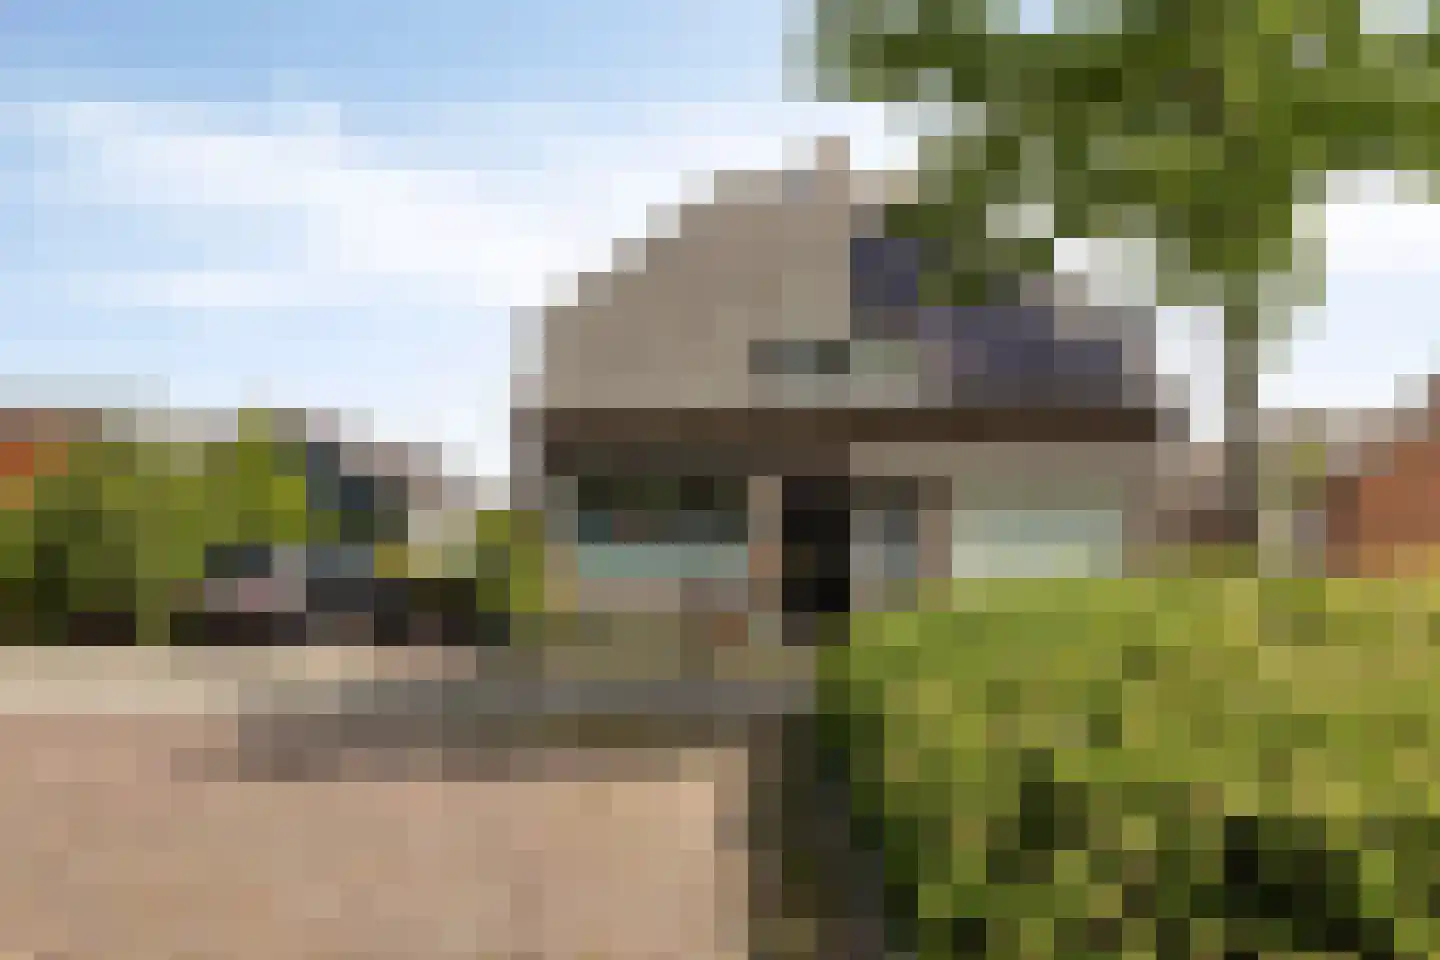
Seinmolen 10 in Bleiswijk biedt een trendy en instapklare eengezinswoning, grondig gerenoveerd in 2025. De woning heeft een ruime woonkamer met open keuken en toegang tot de geopende achtertuin. Op de eerste verdieping bevindt zich een grote slaapkamer met erkerraam en schuifkast, plus badkamer en toilet op de begane grond. De woning heeft parkeergelegenheid en is gelegen in de rustige Molenbuurt, nabij het centrum van Bleiswijk en recreatiegebied 'De Rottemeren'. Toegang tot de unieke website en Move.nl dossier biedt extra informatie bij een bezichtiging.
€ 500.000
Cost of copper (estimated): € 11.850
2% transfer tax (€ 10.000) + notary (€ 1.150) + valuation (€ 700)
Total purchase (incl. p.p.): € 511.850
3,21%
Yearly
€ 25.000
Direct available
Estimated mortgage
Indicative gross monthly cost
Based on annuity and 30 year term
Indicative net monthly cost
iDisclaimer: this mortgage calculation is a simplified indication based on general assumptions. No rights can be derived from the results shown. Calculated with 10-annual interest (zonder NHG), automatically determined based on the price limit € 470.000. Source: 10-jaars rente uit mortgage_rates (07-06-2026 03:45). For non-NHG, an 80% mortgage of the market value has been used in this indication.
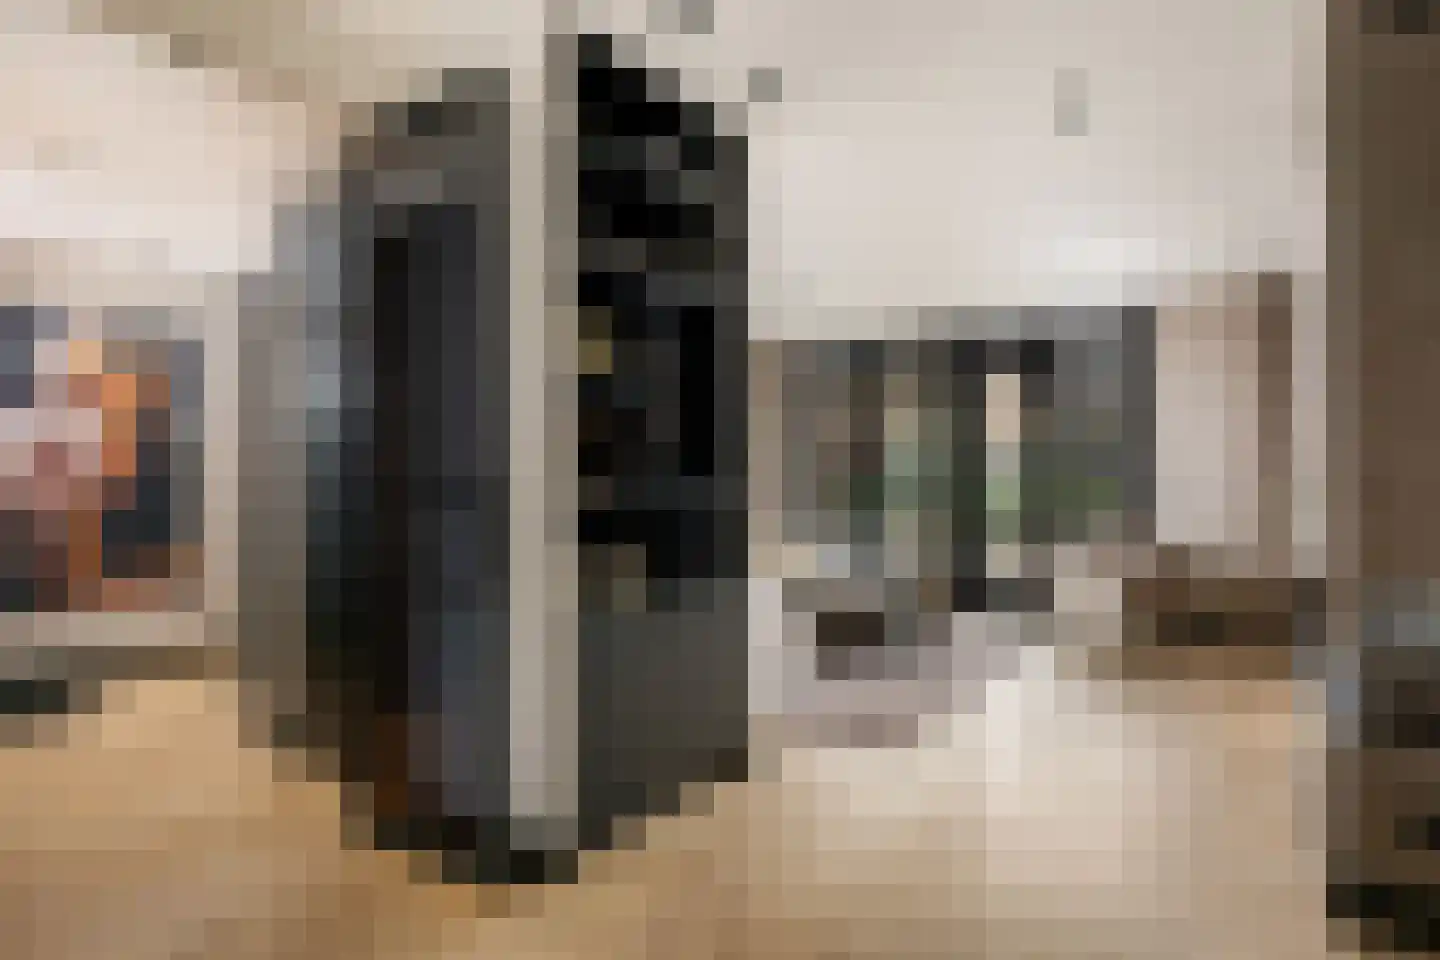
Inloopdouche, toilet, en wastafel
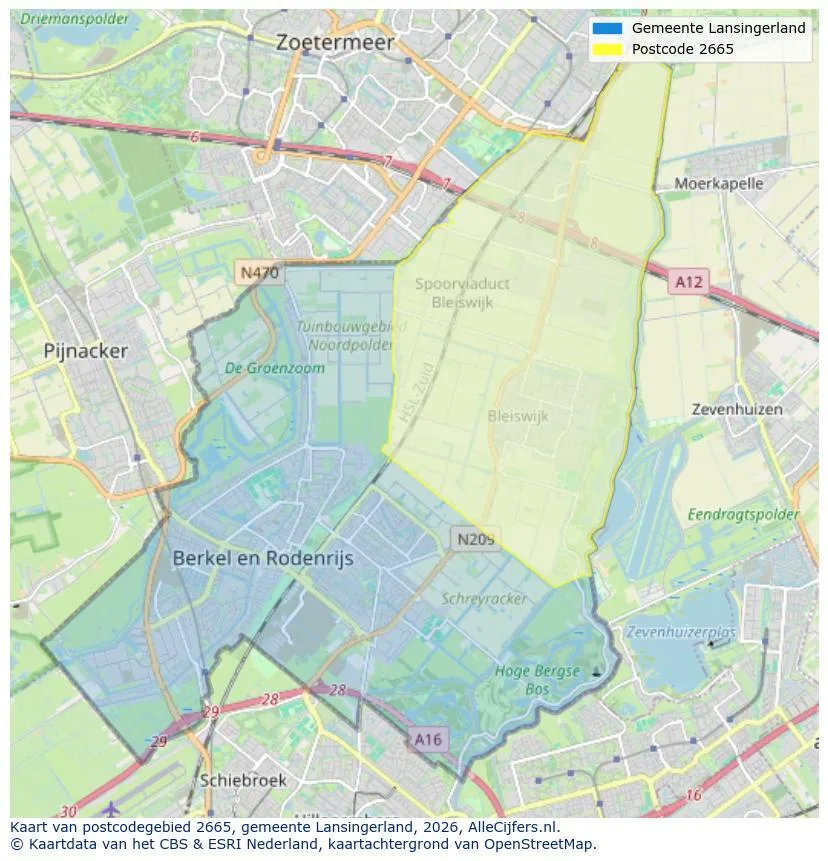
Spatial overview of the work area in Bleiswijk
View current location data on residents, WOZ development, housing stock, energy consumption, business activity and safety in Bleiswijk. In 2025 were there 12.060 residents. The average WOZ value in 2025 is EUR 482.032.
Residents
12.060
Last year: 2025
Average WOZ
EUR 482.032
Last year: 2025
Average income per person.
EUR 33.534
Source: AllNumbers
Crimes (current year)
457
Total registered
| Year | Residents |
|---|---|
| 2021 | 12.045 |
| 2022 | 11.985 |
| 2023 | 12.040 |
| 2024 | 11.890 |
| 2025 | 12.060 |
| Year | Average WOZ |
|---|---|
| 2021 | EUR 365.299 |
| 2022 | EUR 391.262 |
| 2023 | EUR 452.138 |
| 2024 | EUR 475.662 |
| 2025 | EUR 482.032 |
Hoger
2.820
Praktisch
2.160
Middelbaar
3.650
Europa
875
Nederland
9.475
Buiten Europa
1.710
Label A
2.083
Label C
1.445
Label B
819
Label D
358
Label G
167
Label A+
155
Label F
142
Label E
127
Label A++
60
Label A+++
35
Label A++++
14
Label A+++++
11
| Year | Gas (m3) | Electricity (kWh) |
|---|---|---|
| 2020 | 1.185 | 3.145 |
| 2021 | 1.352 | 3.181 |
| 2022 | 1.054 | 2.950 |
| 2023 | 904 | 2.755 |
| 2024 | 886 | 2.802 |
Hoekwoning
Gas: 881 • Electricity: 2.633
Huurwoning
Gas: 814 • Electricity: 2.091
Koopwoning
Gas: 943 • Electricity: 3.044
Appartement
Gas: 637 • Electricity: 1.886
Tussenwoning
Gas: 806 • Electricity: 2.586
Vrijstaande woning
Gas: 1.328 • Electricity: 4.135
Twee-onder-één-kap woning
Gas: 1.152 • Electricity: 3.234
Total number of company establishments: 2.240
| Period | Crimes |
|---|---|
| jan 2025 | 52 |
| jan 2026 | 33 |
| jul 2025 | 42 |
| jun 2025 | 32 |
| mei 2025 | 34 |
| mrt 2025 | 45 |
| nov 2024 | 33 |
| nov 2025 | 35 |
| okt 2024 | 36 |
| okt 2025 | 51 |
| sep 2024 | 43 |
| sep 2025 | 37 |
These figures give an indicative picture of safety trends in the living environment of Bleiswijk.
Short answers based on current local statistics, handy for a quick comparison of the living environment.
Bleiswijk telt in 2025 ongeveer 12.060 inwoners.
De gemiddelde WOZ-waarde in Bleiswijk is in 2025 circa € 482.032.
Het gemiddelde inkomen per inwoner in Bleiswijk ligt rond € 33.534 per jaar.
Voor het huidige jaar gaat het om ongeveer 457 geregistreerde misdrijven. Gebruik deze cijfers als indicatie en vergelijk trends per periode.
In Bleiswijk komt vooral "Tussenwoningen" veel voor, met ongeveer 2.152 woningen.
View more homes in this location.
2665VK Bleiswijk
€ 935.000 k.k.
€ 5.844/m²

2665CX Bleiswijk
€ 550.000 k.k.
€ 5.288/m²

2665RV Bleiswijk
€ 325.000 k.k.
€ 3.533/m²
2665AE Bleiswijk
€ 500.000 k.k.
€ 3.906/m²
2665XL Bleiswijk
€ 575.000 k.k.
€ 5.088/m²
2665AN Bleiswijk
€ 350.000 k.k.
€ 4.795/m²

2665ES Bleiswijk
€ 525.000 k.k.
€ 4.234/m²
2665TL Bleiswijk
€ 598.000 k.k.
€ 5.292/m²
