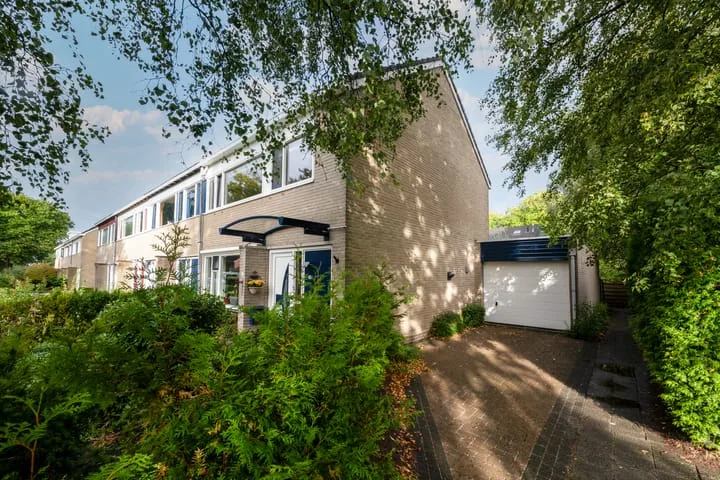
- Sold
Troelstralaan 5
9285RR Buitenpost
€ 235.000 k.k.
€ 2.079/m²
- Living area
- 113 m²
- Land area
- 189 m²
- Bedrooms
- 5
Searching in 54 houses in Buitenpost
Type to search. Use arrow down and arrow up to navigate through results and press Enter to open.
Hidden search suggestions.
View current properties in Buitenpost or search targeted on street, postal code and property characteristics.
View the current housing stock in Buitenpost and quickly filter by price, living area, rooms and more. There are currently 54 houses in this place within our selection. View also 35 sold houses in Buitenpost for extra insight into the local housing market.
9285RR Buitenpost
€ 235.000 k.k.
€ 2.079/m²
9285TT Buitenpost
€ 495.000 k.k.
€ 3.437/m²
9285MS Buitenpost
€ 498.000 k.k.
€ 2.895/m²
9285PH Buitenpost
€ 305.000 k.k.
€ 2.798/m²
9285SN Buitenpost
€ 695.000 k.k.
€ 3.639/m²
9285RD Buitenpost
€ 425.000 k.k.
€ 3.400/m²
9285VJ Buitenpost
€ 465.000 k.k.
€ 3.604/m²
9285NB Buitenpost
€ 325.000 k.k.
€ 2.954/m²
9285MA Buitenpost
€ 375.000 k.k.
€ 3.947/m²
9285ML Buitenpost
€ 365.000 k.k.
€ 2.991/m²
9285SW Buitenpost
€ 475.000 k.k.
€ 3.064/m²
9285TT Buitenpost
€ 325.000 k.k.
€ 2.927/m²
9285RT Buitenpost
€ 265.000 k.k.
€ 2.819/m²
9285SG Buitenpost
€ 295.000 k.k.
€ 2.418/m²
9285RB Buitenpost
€ 485.000 k.k.
€ 3.789/m²
9285ML Buitenpost
€ 495.000 k.k.
€ 3.586/m²
9285WL Buitenpost
€ 650.000 k.k.
€ 5.284/m²
9285LS Buitenpost
€ 489.000 k.k.
€ 0/m²
9285MV Buitenpost
€ 535.000 k.k.
€ 2.772/m²
9285VH Buitenpost
€ 535.000 k.k.
€ 2.891/m²
9285LH Buitenpost
€ 575.000 k.k.
€ 3.194/m²
9285RV Buitenpost
€ 335.000 k.k.
€ 2.745/m²
9285RH Buitenpost
€ 295.000 k.k.
€ 2.543/m²
9285SH Buitenpost
€ 249.000 k.k.
€ 2.394/m²
9285PW Buitenpost
€ 639.000 k.k.
€ 2.730/m²
9285NS Buitenpost
€ 720.000 k.k.
€ 2.175/m²
Get free quotes from real estate agents with local market knowledge. Compare more than 15 real estate agents in Buitenpost.
Selling a home in Buitenpost? Compare all real estate agents in Buitenpost or view the top 10 real estate agents in Buitenpost for extra context for your choice.
Real estate agents make sharper offers when they know you're comparing — ask for quotes for sale or purchase.
Practical answers about housing supply, sales and comparing real estate agents in Buitenpost.
The costs of a real estate agent in Buitenpost depend on commission, setup costs, property presentation and the chosen service. Compare the 15 real estate agents in Buitenpost via the real estate agent page and request multiple quotes to compare rates and approach well.
Within our selection, we are currently showing 54 houses in Buitenpost. View also the sold houses in Buitenpost to compare the current offering with recent transactions.
Take into account not only price and living area but also maintenance, energy label, location, outdoor space and sales status. This way you compare houses in Buitenpost on more than just the asking price.
A local real estate agent knows the neighborhoods, recent transactions and demand in Buitenpost. By comparing 15 real estate agents in the region you get a better insight into prices, sales strategy and expected yield; the top 10 in Buitenpost provides a useful starting point.
Yes, when making a sales plan, a valuation in Buitenpost is wise. You gain insight into a realistic asking price and can then compare offers from real estate agents specifically.
View current location data on residents, WOZ development, housing stock, energy consumption, business activity and safety in Buitenpost. In 2026 were there 5.913 residents. The average WOZ value in 2025 is EUR 281.852.
These figures help to better assess and compare the housing stock in Buitenpost with recent sold homes. Orient yourself then on suitable top real estate agents in Buitenpost for sales advice in this region.
Residents
5.913
Last year: 2026
Average WOZ
EUR 281.852
Last year: 2025
Average income per person.
EUR 25.358
Source: AllNumbers
Crimes (current year)
142
Total registered
| Year | Residents |
|---|---|
| 2021 | 5.775 |
| 2022 | 5.795 |
| 2023 | 5.905 |
| 2024 | 5.940 |
| 2025 | 5.925 |
| 2026 | 5.913 |
| Year | Average WOZ |
|---|---|
| 2021 | EUR 200.215 |
| 2022 | EUR 218.397 |
| 2023 | EUR 247.509 |
| 2024 | EUR 261.249 |
| 2025 | EUR 281.852 |
Hoger
1.100
Praktisch
1.160
Middelbaar
1.980
Europa
200
Nederland
5.380
Buiten Europa
355
Label C
706
Label A
546
Label B
484
Label D
318
Label G
217
Label E
194
Label F
143
Label A+++
38
Label A++
22
Label A+
20
Label A++++
16
Label A+++++
1
| Year | Gas (m3) | Electricity (kWh) |
|---|---|---|
| 2020 | 1.386 | 2.531 |
| 2021 | 1.569 | 2.613 |
| 2022 | 1.177 | 2.452 |
| 2023 | 986 | 2.389 |
| 2024 | 951 | 2.497 |
Hoekwoning
Gas: 942 • Electricity: 1.775
Huurwoning
Gas: 845 • Electricity: 1.831
Koopwoning
Gas: 1.074 • Electricity: 2.755
Appartement
Gas: 634 • Electricity: 1.331
Tussenwoning
Gas: 851 • Electricity: 1.811
Vrijstaande woning
Gas: 1.140 • Electricity: 2.999
Twee-onder-één-kap woning
Gas: 902 • Electricity: 2.519
Total number of company establishments: 645
| Period | Crimes |
|---|---|
| jan 2026 | 19 |
| jul 2025 | 5 |
| jun 2025 | 10 |
| mei 2025 | 12 |
| mrt 2025 | 10 |
| mrt 2026 | 11 |
| nov 2024 | 13 |
| nov 2025 | 13 |
| okt 2024 | 7 |
| okt 2025 | 17 |
| sep 2024 | 11 |
| sep 2025 | 12 |
These figures give an indicative picture of safety trends in the living environment of Buitenpost.
Short answers based on current local statistics, handy for a quick comparison of the living environment.
Buitenpost telt in 2026 ongeveer 5.913 inwoners.
De gemiddelde WOZ-waarde in Buitenpost is in 2025 circa € 281.852.
Het gemiddelde inkomen per inwoner in Buitenpost ligt rond € 25.358 per jaar.
Voor het huidige jaar gaat het om ongeveer 142 geregistreerde misdrijven. Gebruik deze cijfers als indicatie en vergelijk trends per periode.
In Buitenpost komt vooral "Vrijstaande woningen" veel voor, met ongeveer 972 woningen.