- Available
Woude 24
1489NC de Woude
€ 2.400 p/m
€ 15/m²
Save as favorite
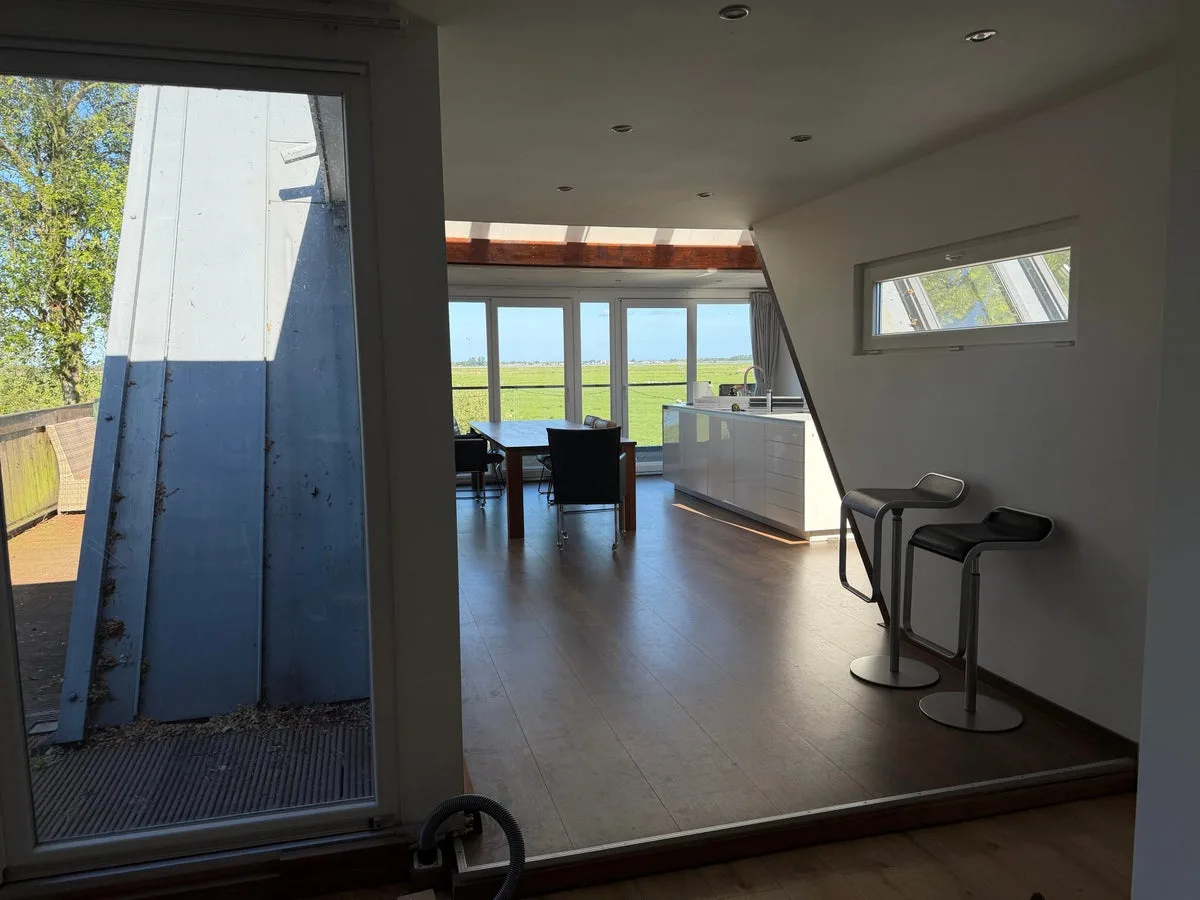
- Living area
- 163 m²
- Land area
- —
- Bedrooms
- 3