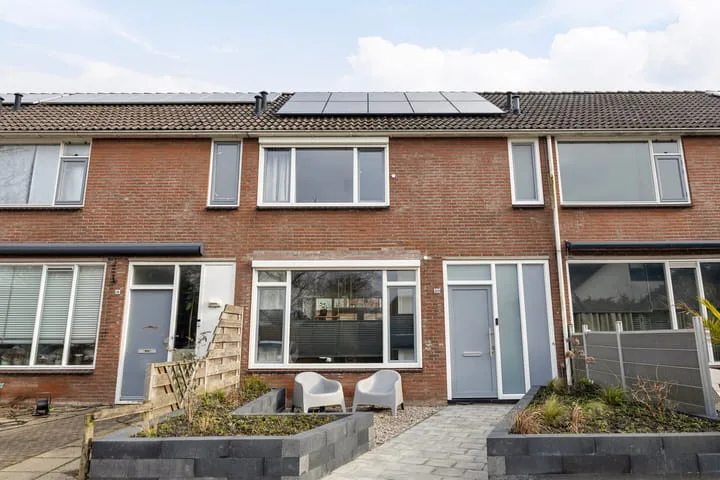
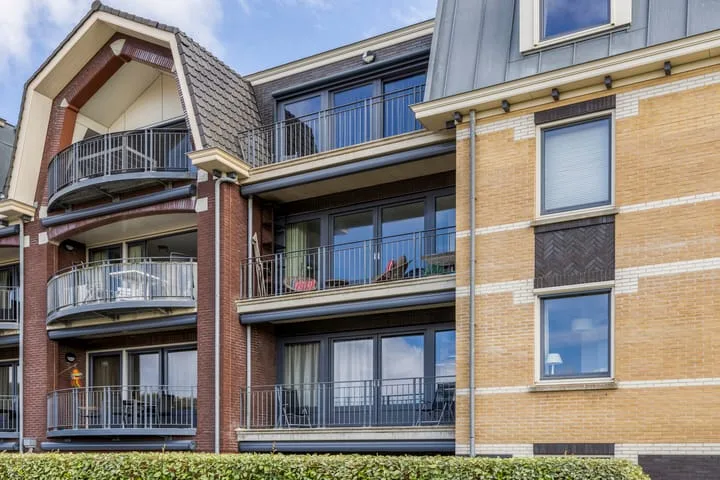
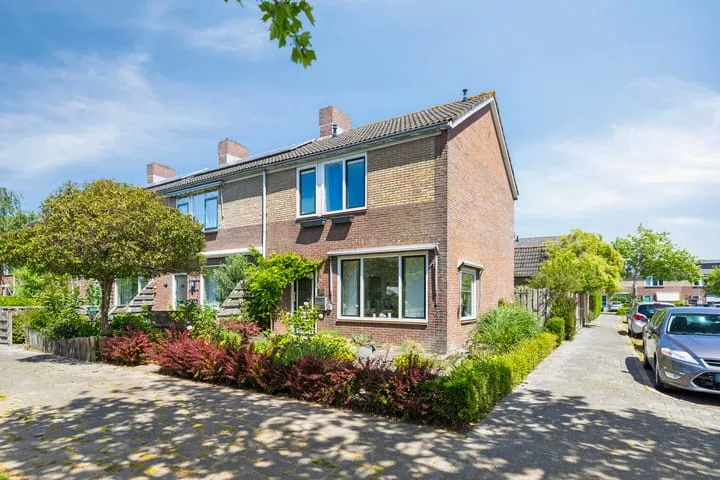
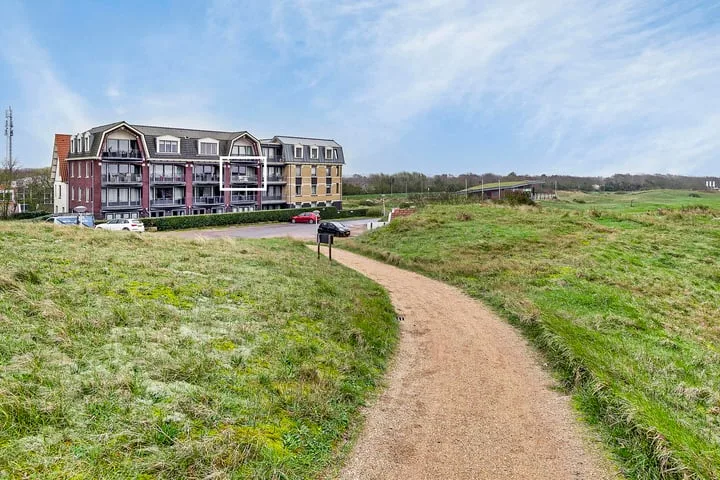
Houses sold in Domburg

View 11 sold houses in Domburg

Connected to: Vastgoed Nederland NVM Makelaars

On this page you will find recently sold homes in Domburg. Use this overview to better estimate selling prices, popular neighborhoods, and the local housing supply before you choose a real estate agent. Also view the current housing supply with 58 houses in Domburg.

Selection

Search and filter homes

Set your preferences and discover homes that suit you.

Total supply 241.886
Filters

Set price, area and other characteristics. Adjust a filter or click on Show homes. Location changes directly above.

Reset filters

You search for

  • Place Domburg
  • Status Sold

Huis verkopen in Domburg? Vergelijk verkoopmakelaars

Bekijk recente verkopen en ontvang gratis offertes van lokale makelaars. Vergelijk meer dan 19 makelaars in Domburg.

Free request a quote

  • Quotes in Domburg
  • Non-binding
  • Personal
  • Gratis tarieven vergelijken

Zelf je woning verkopen in Domburg? Vergelijk verkoopmakelaars in Domburg of bekijk de beste verkoopmakelaars in Domburg als referentie bij jouw keuze.

Vergelijk meerdere offertes

Makelaars maken scherpere voorstellen als ze weten dat je vergelijkt — vraag offertes aan voor verkoop of aankoop.

Frequently asked questions about sold homes in Domburg

Short answers about housing prices, sold homes and comparing real estate agents in Domburg.

Residential and neighborhood statistics in Domburg

View current location data on residents, WOZ development, housing stock, energy consumption, business activity and safety in Domburg. In 2025 were there 1.760 residents. The average WOZ value in 2025 is EUR 554.000.

These figures help to better assess and compare the housing stock in Domburg with recent sold homes. Orient yourself then on suitable top real estate agents in Domburg for sales advice in this region.

Residents

1.760

Last year: 2025

Average WOZ

EUR 554.000

Last year: 2025

Average income per person.

EUR 36.500

Source: AllNumbers

Crimes (current year)

92

Total registered

Demographics and WOZ development

Inhabitants per year

Inhabitants per year in Domburg
Year Residents
2021 1.660
2022 1.660
2023 1.710
2024 1.765
2025 1.760

Annual WOZ value

WOZ value per year in Domburg
Year Average WOZ
2021 EUR 421.000
2022 EUR 456.000
2023 EUR 507.000
2024 EUR 547.000
2025 EUR 554.000

Composition of residents

Age build-up

65+: 670 0-15: 210 15-25: 150 25-45: 300 45-65: 435

Education level

Hoger

450

Praktisch

210

Middelbaar

510

Origin of residents (2025)

Europa

255

Nederland

1.365

Buiten Europa

145

Housing stock and construction periods

Types of homes

Hoekwoningen 167
Appartementen 198
Tussenwoningen 223
Vrijstaande woningen 374
Twee-onder-één-kap woningen 171

Construction period of buildings

Voor 1700 5
1700 tot 1900 44
1900 tot 1925 148
1925 tot 1950 136
1950 tot 1970 268
1970 tot 1980 267
1980 tot 1990 213
1990 tot 2000 295
2000 tot 2010 97
2010 tot 2020 75
2020 en later 152

Energy and sustainability

Energy label distribution

Label C

420

Label A

338

Label B

296

Label D

151

Label F

148

Label G

136

Label E

87

Label A+

48

Label A+++

27

Label A++

11

Label A+++++

6

Label A++++

5

Average energy consumption per year

Average energy consumption per year in Domburg
Year Gas (m3) Electricity (kWh)
2020 1.420 2.670
2021 1.610 2.860
2022 1.310 2.770
2023 1.150 2.660
2024 1.120 2.700

Consumption per house type

Hoekwoning

Gas: 1.060 • Electricity: 2.460

Huurwoning

Gas: 1.120 • Electricity: 2.320

Koopwoning

Gas: 1.150 • Electricity: 2.790

Appartement

Gas: 880 • Electricity: 2.410

Tussenwoning

Gas: 920 • Electricity: 2.050

Vrijstaande woning

Gas: 1.590 • Electricity: 3.400

Twee-onder-één-kap woning

Gas: 1.170 • Electricity: 2.680

Business activity in Domburg (2025)

Handel en HORECA 140
Nijverheid en energie 25
Zakelijke dienstverlening 65
Overheid, onderwijs en zorg 50
Landbouw, bosbouw en visserij 10
Vervoer, informatie en communicatie 10
Financiele diensten en onroerendgoed 30
Cultuur, recreatie en overige diensten 40

Total number of company establishments: 365

Recent crime statistics

Recent crime statistics in Domburg
Period Crimes
jan 2026 3
jul 2025 21
jun 2025 5
mei 2025 5
mrt 2025 1
mrt 2026 6
nov 2024 4
nov 2025 4
okt 2024 4
okt 2025 12
sep 2024 19
sep 2025 9

These figures give an indicative picture of safety trends in the living environment of Domburg.

Frequently asked questions about living in Domburg

Short answers based on current local statistics, handy for a quick comparison of the living environment.

Hoeveel inwoners heeft Domburg?

Domburg telt in 2025 ongeveer 1.760 inwoners.

Wat is de gemiddelde WOZ-waarde in Domburg?

De gemiddelde WOZ-waarde in Domburg is in 2025 circa € 554.000.

Wat is het gemiddelde inkomen per inwoner in Domburg?

Het gemiddelde inkomen per inwoner in Domburg ligt rond € 36.500 per jaar.

Hoe veilig is wonen in Domburg?

Voor het huidige jaar gaat het om ongeveer 92 geregistreerde misdrijven. Gebruik deze cijfers als indicatie en vergelijk trends per periode.

Welke woningtypen komen het meest voor in Domburg?

In Domburg komt vooral "Vrijstaande woningen" veel voor, met ongeveer 374 woningen.

Receive free, non-binding quotes

Compare multiple real estate agents and choose the best match.