
Residents
82.545
Last year: 2026
6711AP Ede • Gelderland
€ 250.000 k.k.
Cost of copper (estimated): € 6.850
2% transfer tax (€ 5.000) + notary (€ 1.150) + valuation (€ 700)
Total incl. VAT: € 256.850
Purchase price /m²: € 5.434
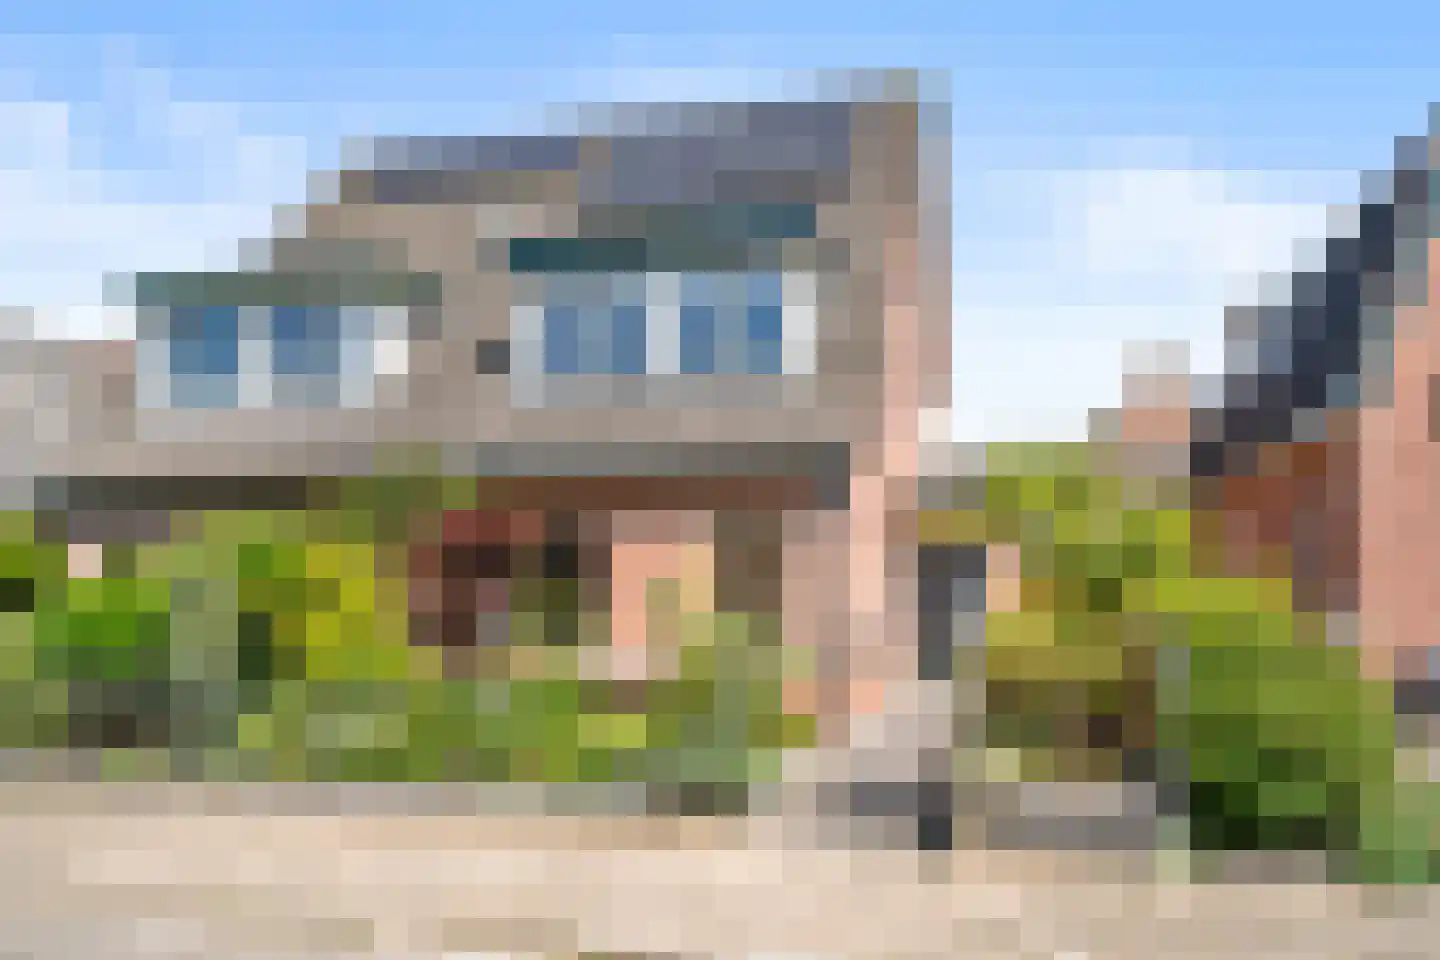
Midden in het centrum van Ede in een karakteristiek pand met oorspronkelijk bouwjaar 1920 gelegen, modern en energiezuinig 2-KAMERAPPARTEMENT op de eerste woonlaag boven ‘De Zuivelhoeve’. Indeling: centrale entree met een videofooninstallatie, hal, woonkamer met veel lichtinval vanwege de grote raampartijen, moderne open keuken voorzien van een koelkast met een vriesvak, combimagnetron, inductiekookplaat en een rvs afzuigkap, slaapkamer, badkamer met een douchecabine, toilet en een wastafel. Verwarming en warm water d.m.v. een HR combiketel (2021). Dit leuke instapklare appartement is voorzien van een visgraat pvc vloer. Op loopafstand bevinden zich diverse winkels, horecagelegenheden en station Ede Centrum. De bossen en intercitystation Ede-Wageningen zijn op korte fietsafstand te bereiken. Oorspronkelijk bouwjaar ca. 1920, in 2021 is d.m.v. een opbouw dit appartement gerealiseerd. Inhoud ca. 172 m³. Woonopp. ca. 46 m². Energielabel A. De servicekosten bedragen € 91,24 per maand. Bekijk alle kenmerken
€ 250.000
Cost of copper (estimated): € 6.850
2% transfer tax (€ 5.000) + notary (€ 1.150) + valuation (€ 700)
Total purchase (incl. p.p.): € 256.850
3,02%
Yearly
€ 12.500
Direct available
Estimated mortgage
Indicative gross monthly cost
Based on annuity and 30 year term
Indicative net monthly cost
iDisclaimer: this mortgage calculation is a simplified indication based on general assumptions. No rights can be derived from the results shown. Calculated with 10-annual interest (met NHG), automatically determined based on the price limit € 470.000. Source: 10-jaars rente uit mortgage_rates (08-06-2026 03:45).
Douche, toilet, en wastafel
Discover where agents are active in Ede
View current location data on residents, WOZ development, housing stock, energy consumption, business activity and safety in Ede. In 2026 were there 82.545 residents. The average WOZ value in 2025 is EUR 387.539.
Residents
82.545
Last year: 2026
Average WOZ
EUR 387.539
Last year: 2025
Average income per person.
EUR 31.853
Source: AllNumbers
Crimes (current year)
3.392
Total registered
| Year | Residents |
|---|---|
| 2021 | 76.765 |
| 2022 | 78.010 |
| 2023 | 79.435 |
| 2024 | 81.035 |
| 2025 | 81.700 |
| 2026 | 82.545 |
| Year | Average WOZ |
|---|---|
| 2021 | EUR 268.097 |
| 2022 | EUR 291.576 |
| 2023 | EUR 340.390 |
| 2024 | EUR 365.994 |
| 2025 | EUR 387.539 |
Hoger
20.890
Praktisch
14.860
Middelbaar
24.850
Europa
4.825
Nederland
62.230
Buiten Europa
14.655
Label A
11.729
Label C
9.795
Label B
5.699
Label D
2.163
Label E
1.674
Label G
1.596
Label A++
1.456
Label A+
1.424
Label F
1.243
Label A+++
848
Label A++++
98
Label A+++++
30
| Year | Gas (m3) | Electricity (kWh) |
|---|---|---|
| 2020 | 942 | 2.754 |
| 2021 | 1.035 | 2.781 |
| 2022 | 803 | 2.610 |
| 2023 | 666 | 2.448 |
| 2024 | 640 | 2.507 |
Hoekwoning
Gas: 783 • Electricity: 2.674
Huurwoning
Gas: 497 • Electricity: 1.951
Koopwoning
Gas: 788 • Electricity: 2.770
Appartement
Gas: 415 • Electricity: 1.771
Tussenwoning
Gas: 675 • Electricity: 2.428
Vrijstaande woning
Gas: 1.228 • Electricity: 3.699
Twee-onder-één-kap woning
Gas: 981 • Electricity: 3.055
Total number of company establishments: 10.210
| Period | Crimes |
|---|---|
| jan 2026 | 289 |
| jul 2025 | 293 |
| jun 2025 | 255 |
| mei 2025 | 252 |
| mrt 2025 | 290 |
| mrt 2026 | 391 |
| nov 2024 | 273 |
| nov 2025 | 313 |
| okt 2024 | 334 |
| okt 2025 | 298 |
| sep 2024 | 204 |
| sep 2025 | 269 |
These figures give an indicative picture of safety trends in the living environment of Ede.
Short answers based on current local statistics, handy for a quick comparison of the living environment.
Ede telt in 2026 ongeveer 82.545 inwoners.
De gemiddelde WOZ-waarde in Ede is in 2025 circa € 387.539.
Het gemiddelde inkomen per inwoner in Ede ligt rond € 31.853 per jaar.
Voor het huidige jaar gaat het om ongeveer 3.392 geregistreerde misdrijven. Gebruik deze cijfers als indicatie en vergelijk trends per periode.
In Ede komt vooral "Appartementen" veel voor, met ongeveer 14.755 woningen.
View more homes in this location.
6718TD Ede
€ 2.495.000 k.k.
€ 6.671/m²

6711NB Ede
€ 1.145 p/m
€ 12/m²
6712BT Ede
€ 745.000 k.k.
€ 4.776/m²
6717KR Ede
€ 550.000 k.k.
€ 4.741/m²
6717GS Ede
€ 545.000 k.k.
€ 4.225/m²
6718NS Ede
€ 490.000 k.k.
€ 3.984/m²
6711DH Ede
€ 275.000 k.k.
€ 5.729/m²
6717GT Ede
€ 495.000 k.k.
€ 4.541/m²
