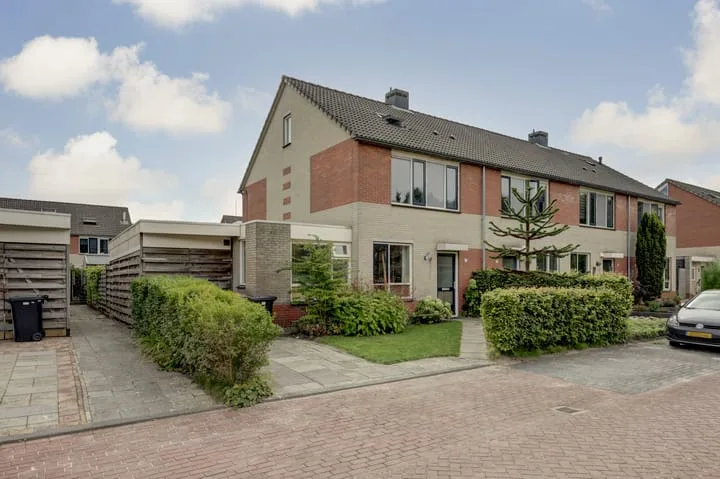
Houses sold in Ens

View 31 sold houses in Ens

Connected to: Vastgoed Nederland NVM Makelaars

On this page you will find recently sold homes in Ens. Use this overview to better estimate selling prices, popular neighborhoods, and the local housing supply before you choose a real estate agent. Also view the current housing supply with 41 houses in Ens.

Selection

Search and filter homes

Set your preferences and discover homes that suit you.

Total supply 243.331
Filters

Set price, area and other characteristics. Adjust a filter or click on Show homes. Location changes directly above.

Reset filters

You search for

  • Place Ens
  • Status Sold

Huis verkopen in Ens? Vergelijk verkoopmakelaars

Bekijk recente verkopen en ontvang gratis offertes van lokale makelaars. Vergelijk meer dan 15 makelaars in Ens.

Free request a quote

  • Quotes in Ens
  • Non-binding
  • Personal
  • Compare free rates

Zelf je woning verkopen in Ens? Vergelijk verkoopmakelaars in Ens of bekijk de beste verkoopmakelaars in Ens als referentie bij jouw keuze.

Vergelijk meerdere offertes

Makelaars maken scherpere voorstellen als ze weten dat je vergelijkt — vraag offertes aan voor verkoop of aankoop.

Frequently asked questions about sold homes in Ens

Short answers about housing prices, sold homes and comparing real estate agents in Ens.

Residential and neighborhood statistics in Ens

View current location data on residents, WOZ development, housing stock, energy consumption, business activity and safety in Ens. In 2025 were there 3.475 residents. The average WOZ value in 2025 is EUR 332.000.

These figures help to better assess and compare the housing stock in Ens with recent sold homes. Orient yourself then on suitable top real estate agents in Ens for sales advice in this region.

Residents

3.475

Last year: 2025

Average WOZ

EUR 332.000

Last year: 2025

Average income per person.

EUR 31.200

Source: AllNumbers

Crimes (current year)

56

Total registered

Demographics and WOZ development

Inhabitants per year

Inhabitants per year in Ens
Year Residents
2021 3.110
2022 3.160
2023 3.390
2024 3.335
2025 3.475

Annual WOZ value

WOZ value per year in Ens
Year Average WOZ
2021 EUR 256.000
2022 EUR 279.000
2023 EUR 332.000
2024 EUR 320.000
2025 EUR 332.000

Composition of residents

Age build-up

65+: 600 0-15: 585 15-25: 460 25-45: 930 45-65: 905

Education level

Hoger

580

Praktisch

690

Middelbaar

1.350

Origin of residents (2025)

Europa

470

Nederland

2.855

Buiten Europa

155

Housing stock and construction periods

Types of homes

Hoekwoningen 287
Appartementen 238
Tussenwoningen 404
Vrijstaande woningen 365
Twee-onder-één-kap woningen 204

Construction period of buildings

Voor 1700 0
1700 tot 1900 0
1900 tot 1925 0
1925 tot 1950 157
1950 tot 1970 441
1970 tot 1980 254
1980 tot 1990 99
1990 tot 2000 213
2000 tot 2010 78
2010 tot 2020 110
2020 en later 78

Energy and sustainability

Energy label distribution

Label A

401

Label C

310

Label B

298

Label F

181

Label E

91

Label D

90

Label G

30

Label A+++

26

Label A+

19

Label A++

19

Label A++++

5

Label A+++++

0

Average energy consumption per year

Average energy consumption per year in Ens
Year Gas (m3) Electricity (kWh)
2020 1.410 3.260
2021 1.550 3.330
2022 1.190 3.140
2023 970 3.090
2024 910 3.100

Consumption per house type

Hoekwoning

Gas: 910 • Electricity: 2.700

Huurwoning

Gas: 780 • Electricity: 2.160

Koopwoning

Gas: 1.040 • Electricity: 3.400

Appartement

Gas: 660 • Electricity: 1.950

Tussenwoning

Gas: 800 • Electricity: 2.370

Vrijstaande woning

Gas: 1.350 • Electricity: 4.270

Twee-onder-één-kap woning

Gas: 880 • Electricity: 3.420

Business activity in Ens (2025)

Handel en HORECA 80
Nijverheid en energie 85
Zakelijke dienstverlening 90
Overheid, onderwijs en zorg 55
Landbouw, bosbouw en visserij 120
Vervoer, informatie en communicatie 25
Financiele diensten en onroerendgoed 15
Cultuur, recreatie en overige diensten 35

Total number of company establishments: 500

Recent crime statistics

Recent crime statistics in Ens
Period Crimes
jan 2025 8
jan 2026 4
jul 2025 1
jun 2025 10
mei 2025 1
mrt 2025 6
nov 2024 4
nov 2025 6
okt 2024 11
okt 2025 11
sep 2024 2
sep 2025 6

These figures give an indicative picture of safety trends in the living environment of Ens.

Frequently asked questions about living in Ens

Short answers based on current local statistics, handy for a quick comparison of the living environment.

Hoeveel inwoners heeft Ens?

Ens telt in 2025 ongeveer 3.475 inwoners.

Wat is de gemiddelde WOZ-waarde in Ens?

De gemiddelde WOZ-waarde in Ens is in 2025 circa € 332.000.

Wat is het gemiddelde inkomen per inwoner in Ens?

Het gemiddelde inkomen per inwoner in Ens ligt rond € 31.200 per jaar.

Hoe veilig is wonen in Ens?

Voor het huidige jaar gaat het om ongeveer 56 geregistreerde misdrijven. Gebruik deze cijfers als indicatie en vergelijk trends per periode.

Welke woningtypen komen het meest voor in Ens?

In Ens komt vooral "Tussenwoningen" veel voor, met ongeveer 404 woningen.

Receive free, non-binding quotes

Compare multiple real estate agents and choose the best match.