
Residents
16.056
Last year: 2026
8162TB Epe • Gelderland
€ 459.000 k.k.
Cost of copper (estimated): € 11.030
2% transfer tax (€ 9.180) + notary (€ 1.150) + valuation (€ 700)
Total incl. VAT: € 470.030
Purchase price /m²: € 3.278
Deze gezinswoning is verkocht door middel van (stille verkoop). Nieuwsgierig hoe dat werkt? U bent van harte welkom bij ons op kantoor voor meer informatie! Er gebeurt meer achter de schermen.. Specialist voor mooie plekjes op de Veluwe. De Haan Makelaars Brinklaan 5 8161 CW EPE 0578 613000
€ 459.000
Cost of copper (estimated): € 11.030
2% transfer tax (€ 9.180) + notary (€ 1.150) + valuation (€ 700)
Total purchase (incl. p.p.): € 470.030
3,02%
Yearly
€ 22.950
Direct available
Estimated mortgage
Indicative gross monthly cost
Based on annuity and 30 year term
Indicative net monthly cost
iDisclaimer: this mortgage calculation is a simplified indication based on general assumptions. No rights can be derived from the results shown. Calculated with 10-annual interest (met NHG), automatically determined based on the price limit € 470.000. Source: 10-jaars rente uit mortgage_rates (07-06-2026 03:45).
Inloopdouche, ligbad, toilet, en wastafelmeubel
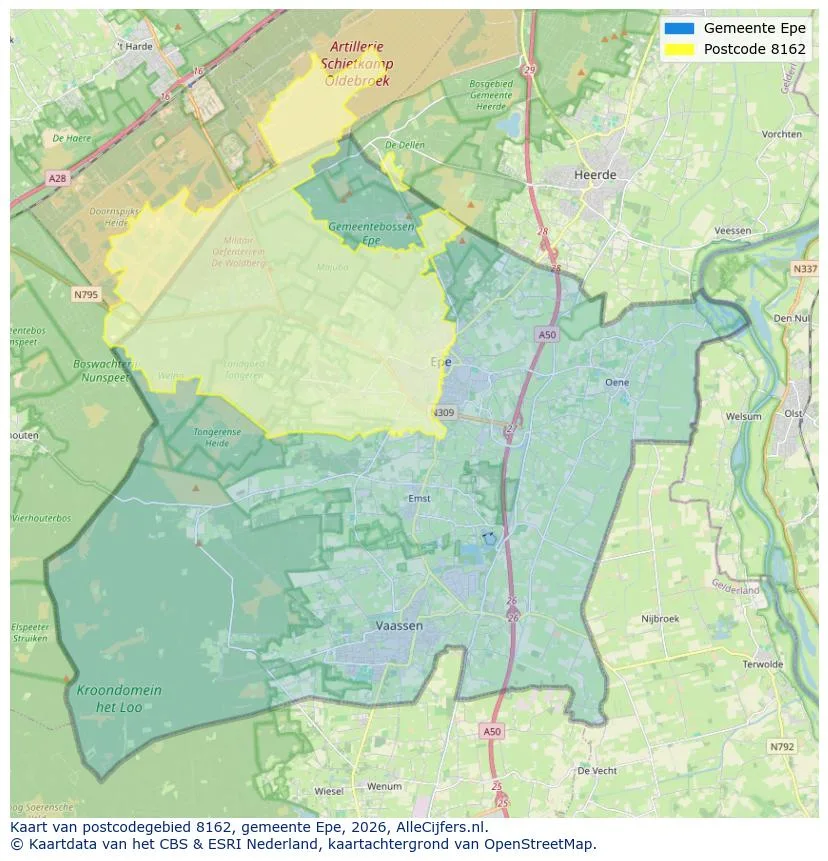
Explore Epe and the surrounding areas
View current location data on residents, WOZ development, housing stock, energy consumption, business activity and safety in Epe. In 2026 were there 16.056 residents. The average WOZ value in 2025 is EUR 468.000.
Residents
16.056
Last year: 2026
Average WOZ
EUR 468.000
Last year: 2025
Average income per person.
EUR 34.600
Source: AllNumbers
Crimes (current year)
422
Total registered
| Year | Residents |
|---|---|
| 2021 | 15.685 |
| 2022 | 15.680 |
| 2023 | 15.670 |
| 2024 | 15.700 |
| 2025 | 16.005 |
| 2026 | 16.056 |
| Year | Average WOZ |
|---|---|
| 2021 | EUR 334.000 |
| 2022 | EUR 366.000 |
| 2023 | EUR 448.000 |
| 2024 | EUR 462.000 |
| 2025 | EUR 468.000 |
Hoger
3.180
Praktisch
3.440
Middelbaar
4.780
Europa
860
Nederland
13.610
Buiten Europa
1.535
Label C
2.033
Label A
1.790
Label B
1.088
Label D
970
Label G
789
Label E
574
Label F
562
Label A+++
207
Label A+
96
Label A++
71
Label A++++
19
Label A+++++
8
| Year | Gas (m3) | Electricity (kWh) |
|---|---|---|
| 2020 | 1.520 | 3.090 |
| 2021 | 1.670 | 3.160 |
| 2022 | 1.310 | 2.960 |
| 2023 | 1.080 | 2.800 |
| 2024 | 1.040 | 2.900 |
Hoekwoning
Gas: 990 • Electricity: 2.480
Huurwoning
Gas: 800 • Electricity: 2.000
Koopwoning
Gas: 1.230 • Electricity: 3.240
Appartement
Gas: 660 • Electricity: 1.940
Tussenwoning
Gas: 870 • Electricity: 2.330
Vrijstaande woning
Gas: 1.580 • Electricity: 3.940
Twee-onder-één-kap woning
Gas: 1.190 • Electricity: 2.950
Total number of company establishments: 2.080
| Period | Crimes |
|---|---|
| jan 2026 | 30 |
| jul 2025 | 59 |
| jun 2025 | 40 |
| mei 2025 | 37 |
| mrt 2025 | 42 |
| mrt 2026 | 46 |
| nov 2024 | 33 |
| nov 2025 | 26 |
| okt 2024 | 42 |
| okt 2025 | 26 |
| sep 2024 | 40 |
| sep 2025 | 26 |
These figures give an indicative picture of safety trends in the living environment of Epe.
Short answers based on current local statistics, handy for a quick comparison of the living environment.
Epe telt in 2026 ongeveer 16.056 inwoners.
De gemiddelde WOZ-waarde in Epe is in 2025 circa € 468.000.
Het gemiddelde inkomen per inwoner in Epe ligt rond € 34.600 per jaar.
Voor het huidige jaar gaat het om ongeveer 422 geregistreerde misdrijven. Gebruik deze cijfers als indicatie en vergelijk trends per periode.
In Epe komt vooral "Vrijstaande woningen" veel voor, met ongeveer 2.304 woningen.
View more homes in this location.

8162AD Epe
€ 695.000 k.k.
€ 2.970/m²

8161CB Epe
€ 950.000 k.k.
€ 5.398/m²

8161HL Epe
€ 470.000 k.k.
€ 3.730/m²

8162PT Epe
€ 125.000 k.k.

8162PH Epe
€ 125.000 k.k.

8162VD Epe
€ 695.000 k.k.
€ 7.473/m²

8161CW Epe
€ 789.000 k.k.
€ 3.430/m²

8162RK Epe
€ 1.495.000 k.k.
€ 4.153/m²
