Residents
1.743
Last year: 2026
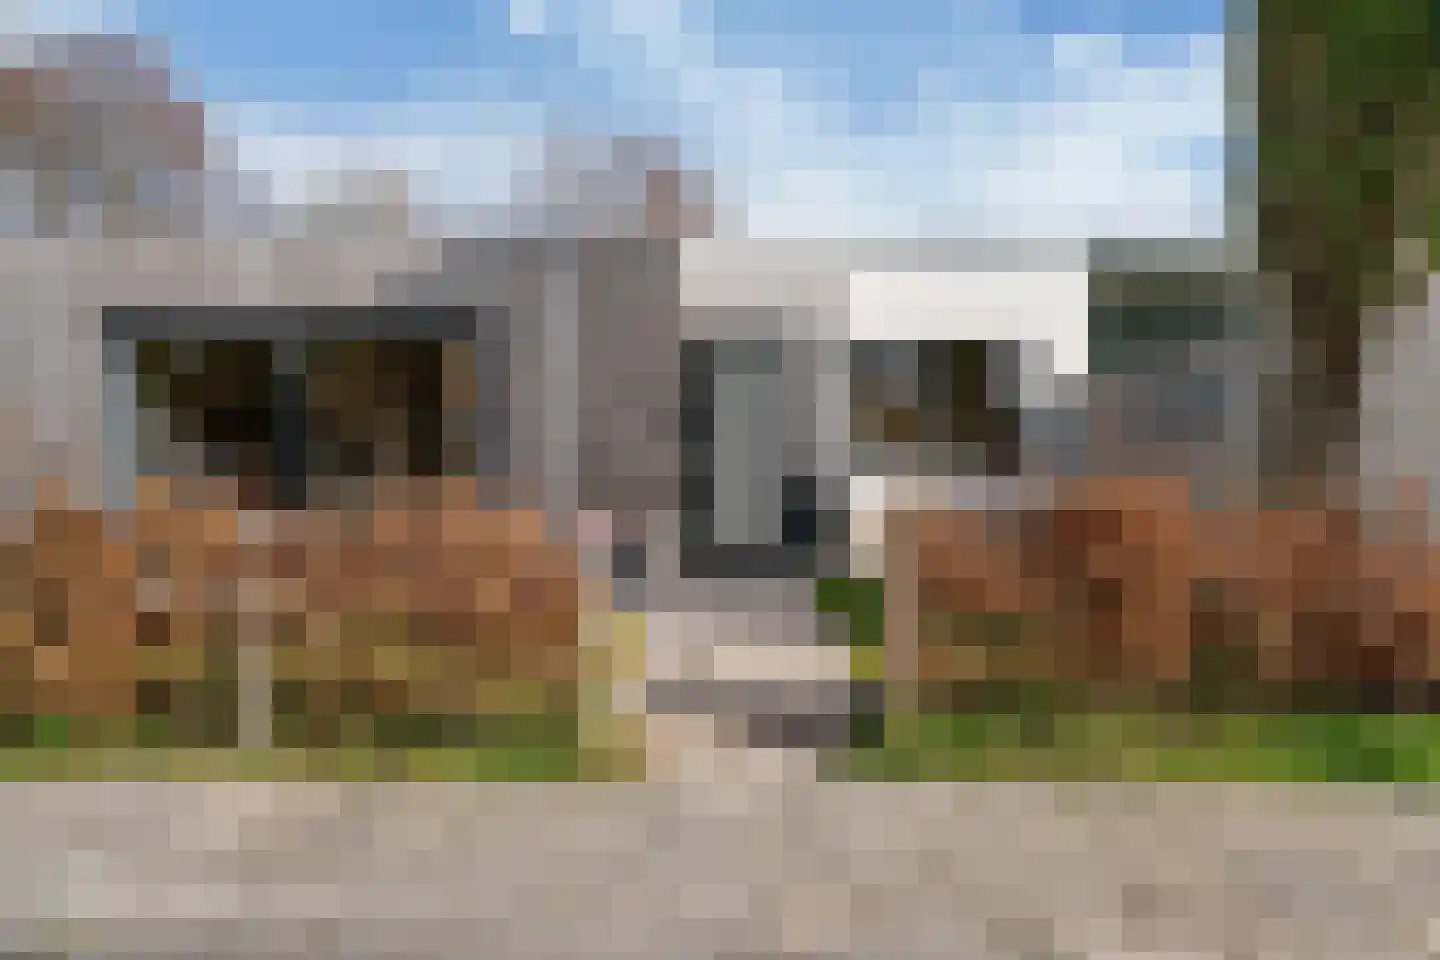
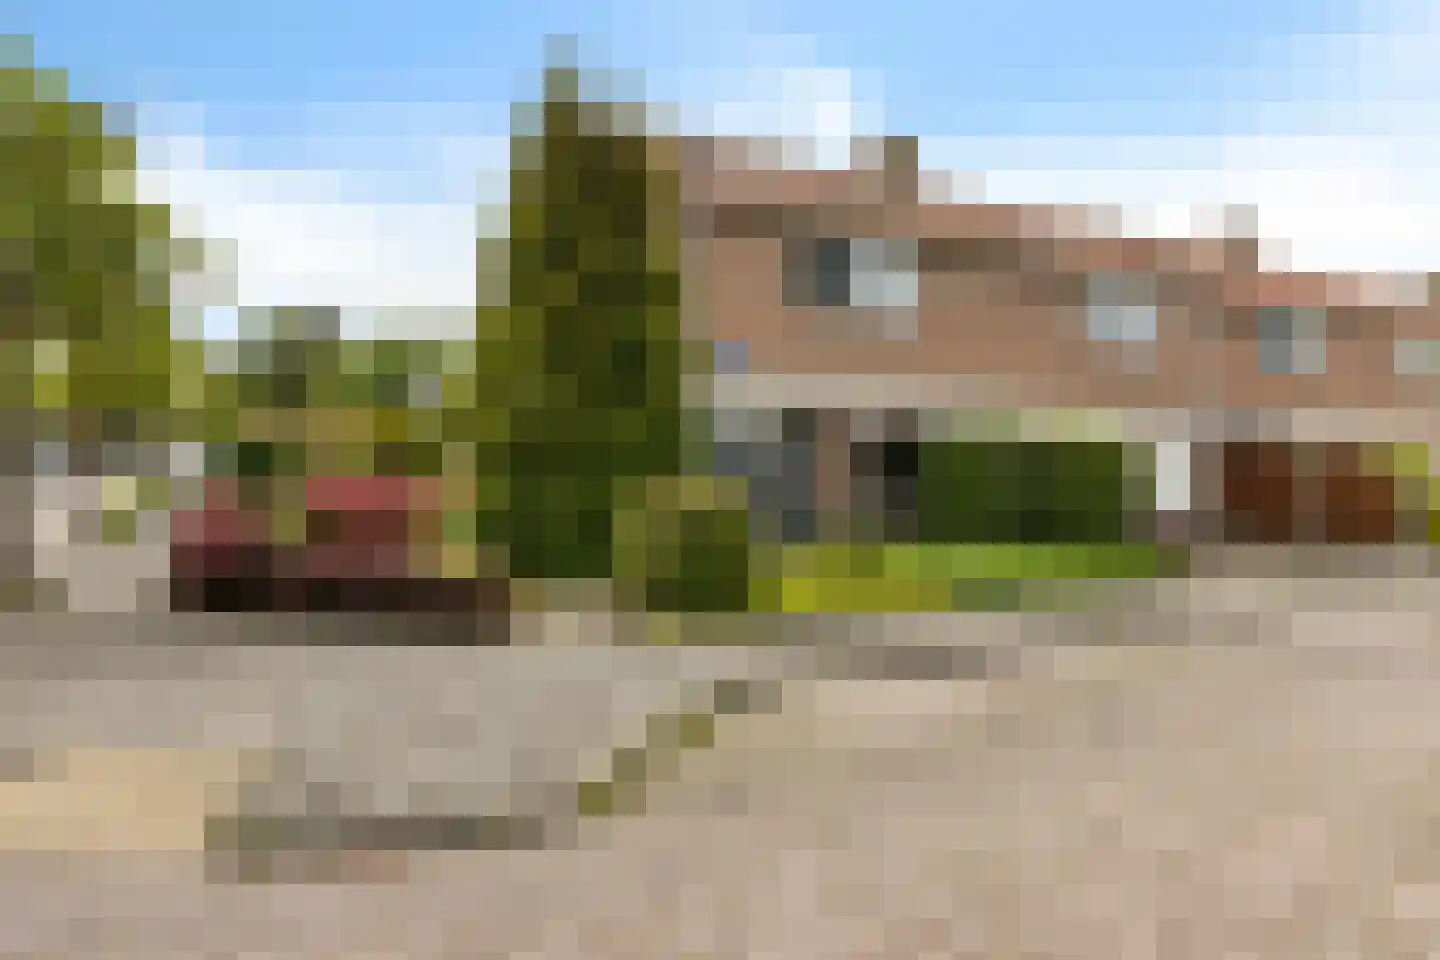
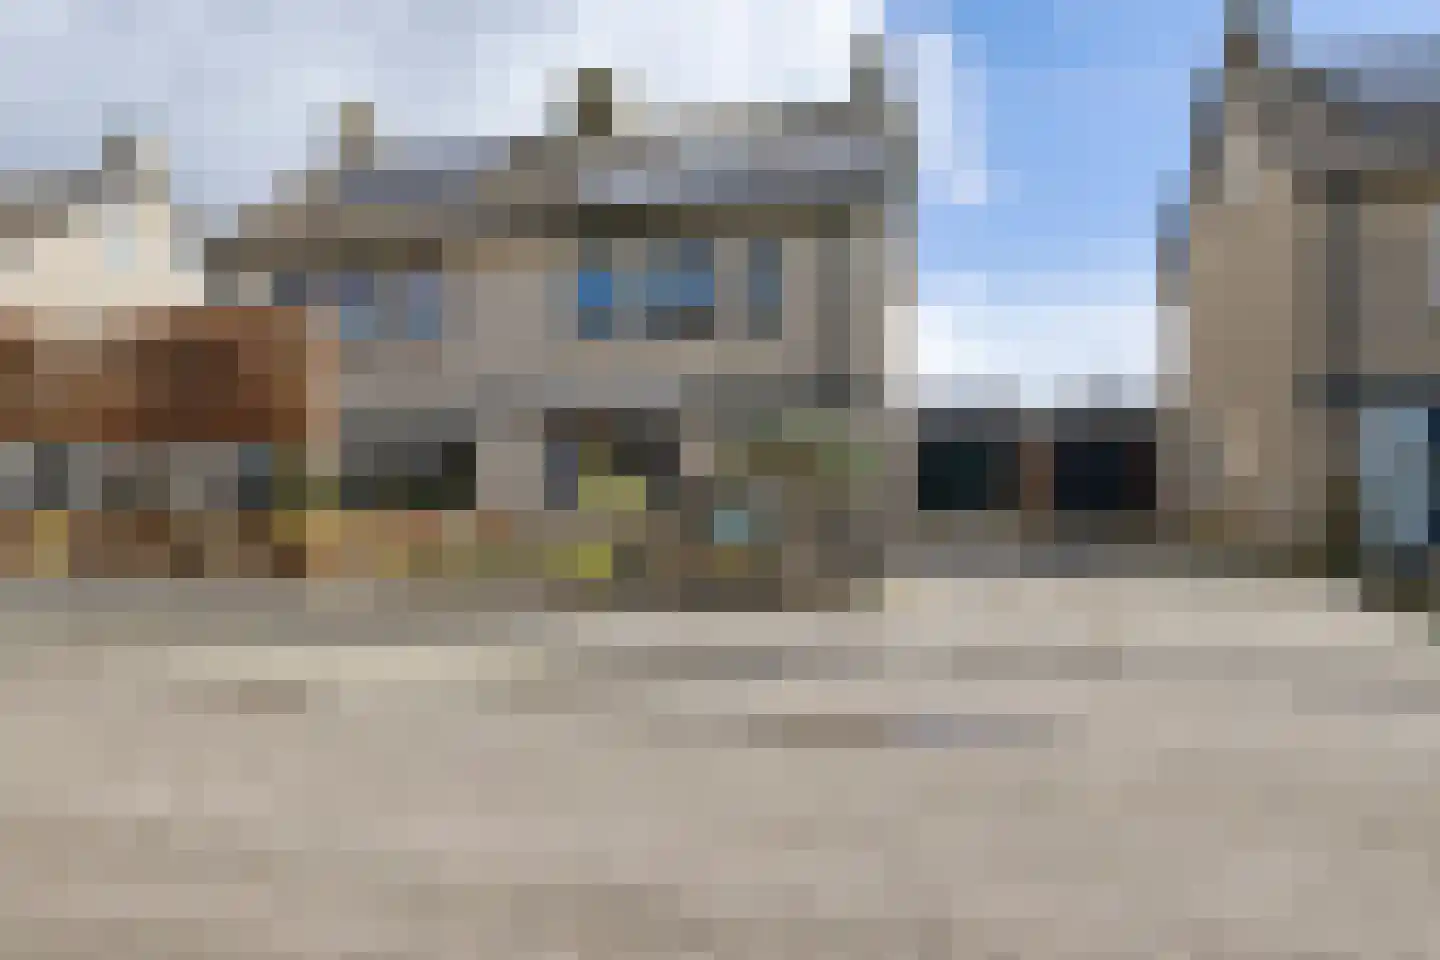
8311AZ Espel • Flevoland
€ 249.000 k.k.
Cost of copper (estimated): € 6.830
2% transfer tax (€ 4.980) + notary (€ 1.150) + valuation (€ 700)
Total incl. VAT: € 255.830
Purchase price /m²: € 4.788
are: Wonen met karakter én comfort in hartje Espel, op het Laantje 4 B in Espel. Deze bijzondere woning is volledig getransformeerd en vernieuwd in 2023, gebouwd op de locatie van een voormalige peuterspeelzaal. Het huis biedt optimale wooncomfort met al zijn ruimtes op de begane grond, waaronder een lichte woonkamer met open keuken, een moderne badkamer en een ruime slaapkamer. Er is ook ruimte voor extra functionaliteit, zoals een mogelijke aanvullende slaapkamer of kantoor. De huidige bewoner heeft met veel liefde extra dingen toegevoegd om een warme, sfeervolle atmosfeer te creëren. De woning staat volledig op de begane grond en heeft een ruime, rustige tuin aan de voorzijde, ideaal om te ontspannen. De verwarming gebeurt via een moderne CV-ketel met vloerverwarming, waardoor het wonen energiezuinig en comfortabel is. De woning heeft een woonoppervlakte van 52 m² en ligt op een perceel van 112 m². Ze ligt in een rustige omgeving, met alle voorzieningen op loopafstand. Er is mogelijkheid tot een persoonlijke aanpassing of extra ruimte, afhankelijk van de behoeften. De verkoop gebeurt op basis van kosten koper, met aanvaarding in overleg. Bezichtigingen zijn uitsluitend mogelijk via Hoekstra Makelaardij BV en meer informatie is te krijgen via 0527-681396 of per e-mail.
€ 249.000
Cost of copper (estimated): € 6.830
2% transfer tax (€ 4.980) + notary (€ 1.150) + valuation (€ 700)
Total purchase (incl. p.p.): € 255.830
3,12%
Yearly
€ 12.450
Direct available
Estimated mortgage
Indicative gross monthly cost
Based on annuity and 30 year term
Indicative net monthly cost
iDisclaimer: this mortgage calculation is a simplified indication based on general assumptions. No rights can be derived from the results shown. Calculated with 10-annual interest (met NHG), automatically determined based on the price limit € 470.000. Source: 10-jaars rente uit mortgage_rates (14-06-2026 03:45).
Inloopdouche en wastafelmeubel
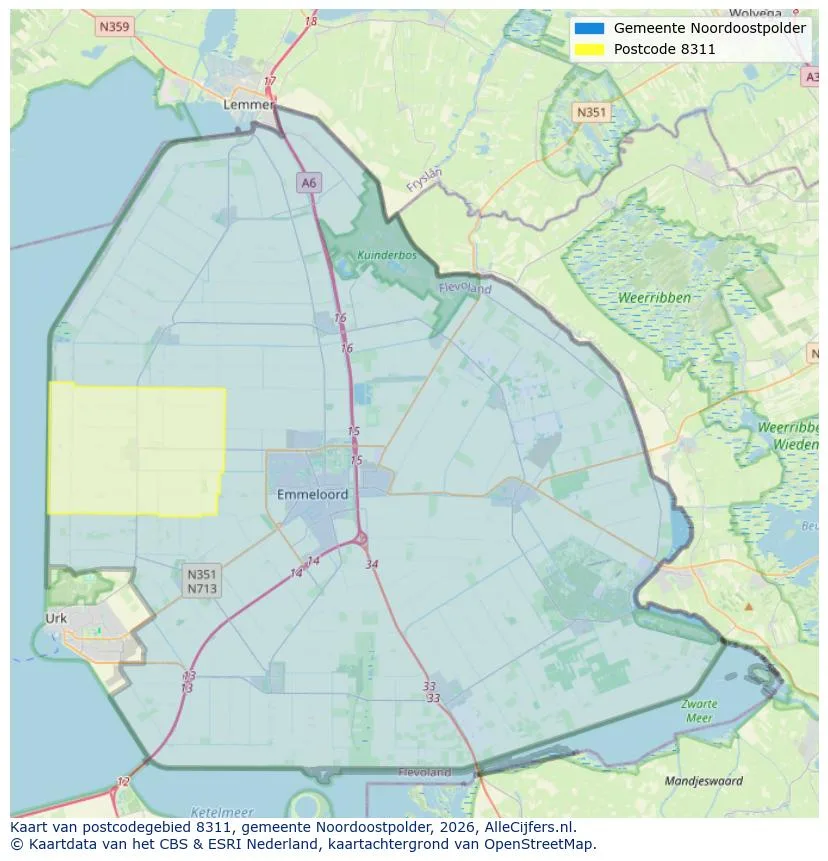
Explore Espel and the surrounding areas
View current location data on residents, WOZ development, housing stock, energy consumption, business activity and safety in Espel. In 2026 were there 1.743 residents. The average WOZ value in 2025 is EUR 403.000.
Residents
1.743
Last year: 2026
Average WOZ
EUR 403.000
Last year: 2025
Average income per person.
EUR 32.000
Source: AllNumbers
Crimes (current year)
20
Total registered
| Year | Residents |
|---|---|
| 2021 | 1.515 |
| 2022 | 1.575 |
| 2023 | 1.680 |
| 2024 | 1.720 |
| 2025 | 1.735 |
| 2026 | 1.743 |
| Year | Average WOZ |
|---|---|
| 2021 | EUR 288.000 |
| 2022 | EUR 310.000 |
| 2023 | EUR 363.000 |
| 2024 | EUR 387.000 |
| 2025 | EUR 403.000 |
Hoger
290
Praktisch
290
Middelbaar
720
Europa
200
Nederland
1.445
Buiten Europa
90
Label A
165
Label C
127
Label F
124
Label B
79
Label E
50
Label D
31
Label A+++
30
Label A+
10
Label G
9
Label A++++
9
Label A++
4
Label A+++++
0
| Year | Gas (m3) | Electricity (kWh) |
|---|---|---|
| 2020 | 1.630 | 3.570 |
| 2021 | 1.750 | 3.670 |
| 2022 | 1.340 | 3.570 |
| 2023 | 1.090 | 3.390 |
| 2024 | 1.010 | 3.410 |
Hoekwoning
Gas: 880 • Electricity: 2.940
Huurwoning
Gas: 1.050 • Electricity: 2.750
Koopwoning
Gas: 1.100 • Electricity: 3.580
Appartement
Gas: 820 • Electricity: 2.330
Tussenwoning
Gas: 810 • Electricity: 2.550
Vrijstaande woning
Gas: 1.570 • Electricity: 4.580
Twee-onder-één-kap woning
Gas: 920 • Electricity: 3.160
Total number of company establishments: 335
| Period | Crimes |
|---|---|
| jan 2026 | 2 |
| jul 2025 | 3 |
| jun 2025 | 1 |
| mei 2025 | 1 |
| mrt 2025 | 1 |
| mrt 2026 | 1 |
| nov 2024 | 3 |
| nov 2025 | 0 |
| okt 2024 | 6 |
| okt 2025 | 4 |
| sep 2024 | 0 |
| sep 2025 | 2 |
These figures give an indicative picture of safety trends in the living environment of Espel.
Short answers based on current local statistics, handy for a quick comparison of the living environment.
Espel telt in 2026 ongeveer 1.743 inwoners.
De gemiddelde WOZ-waarde in Espel is in 2025 circa € 403.000.
Het gemiddelde inkomen per inwoner in Espel ligt rond € 32.000 per jaar.
Voor het huidige jaar gaat het om ongeveer 20 geregistreerde misdrijven. Gebruik deze cijfers als indicatie en vergelijk trends per periode.
In Espel komt vooral "Vrijstaande woningen" veel voor, met ongeveer 226 woningen.
View more homes in this location.
8311AX Espel
€ 289.000 k.k.
€ 3.042/m²

8311PW Espel
€ 325.000 k.k.
€ 3.963/m²
8311AL Espel
€ 419.500 k.k.
€ 3.131/m²
8311BJ Espel
€ 750.000 k.k.
€ 4.688/m²

8311BB Espel
€ 479.500 k.k.
€ 3.930/m²

8311BD Espel
€ 475.000 k.k.
€ 2.950/m²

8311BB Espel
€ 495.000 k.k.
€ 3.808/m²

8311PD Espel
€ 965.000 k.k.
€ 3.814/m²
