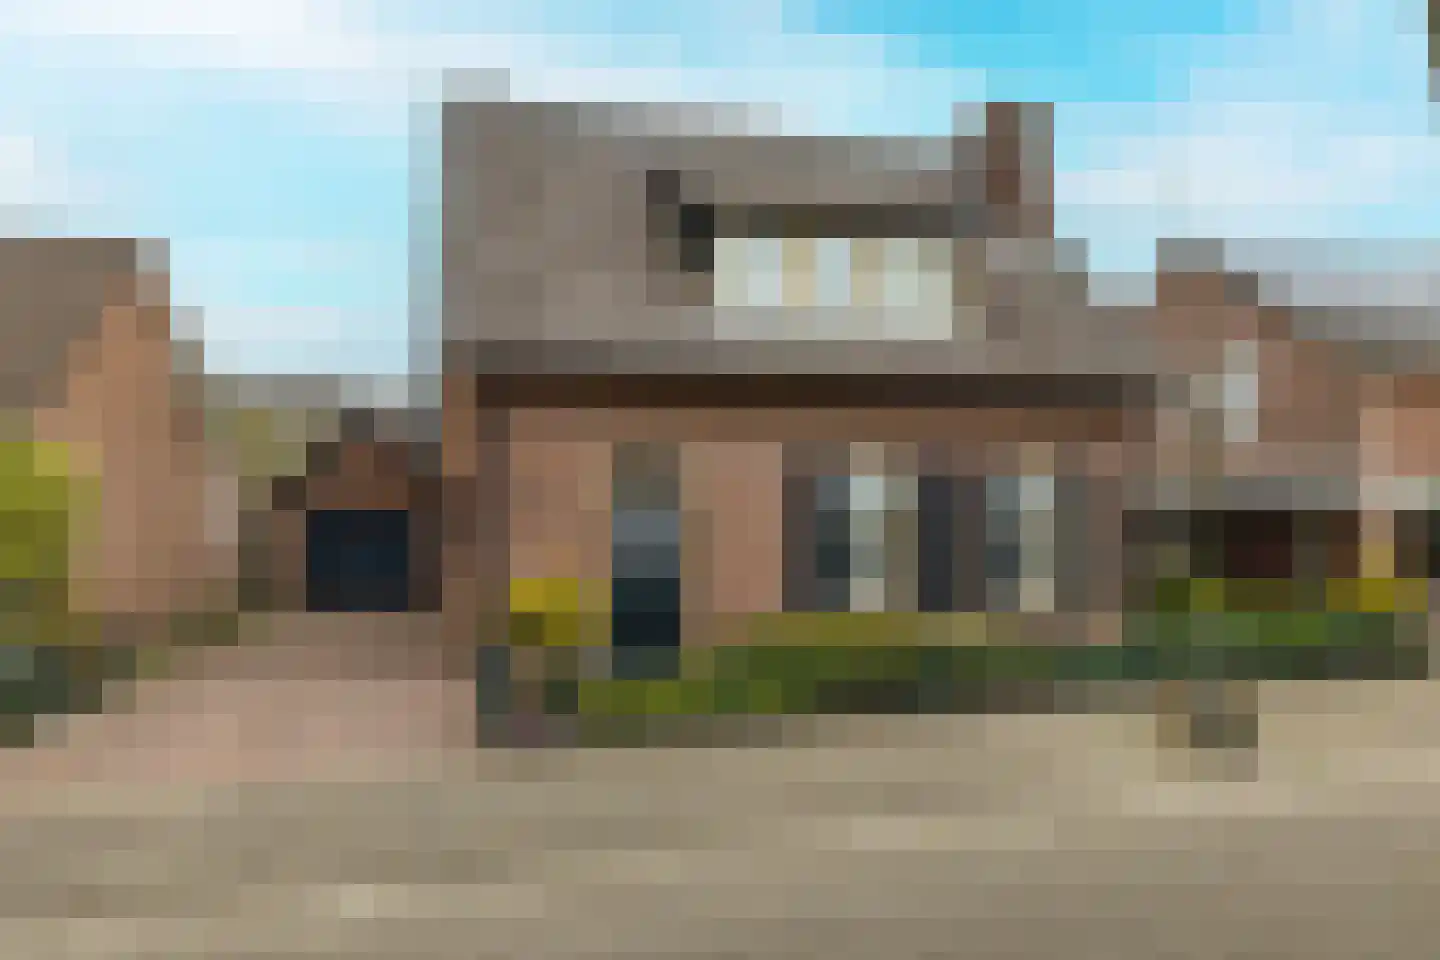
Housing offer in Galder

Searching in 14 houses in Galder

Connected to: Vastgoed Nederland NVM Makelaars

View the current housing stock in Galder and quickly filter by price, living area, rooms and more. There are currently 14 houses in this place within our selection. View also 9 sold houses in Galder for extra insight into the local housing market.

Selection

Search and filter homes

Set your preferences and discover homes that suit you.

Total supply 243.146
Filters

Set price, area and other characteristics. Adjust a filter or click on Show homes. Location changes directly above.

Reset filters

You search for

  • Place Galder

Selling a home in Galder? Compare realtor offers

Get free quotes from real estate agents with local market knowledge. Compare more than 66 real estate agents in Galder.

Free request a quote

  • Quotes in Galder
  • Non-binding
  • Personal
  • Compare free rates

Selling a home in Galder? Compare all real estate agents in Galder or view the top 10 real estate agents in Galder for extra context for your choice.

Compare multiple quotes

Real estate agents make sharper offers when they know you're comparing — ask for quotes for sale or purchase.

Frequently asked questions about homes in Galder

Practical answers about housing supply, sales and comparing real estate agents in Galder.

Residential and neighborhood statistics in Galder

View current location data on residents, WOZ development, housing stock, energy consumption, business activity and safety in Galder. In 2025 were there 1.095 residents. The average WOZ value in 2025 is EUR 539.000.

These figures help to better assess and compare the housing stock in Galder with recent sold homes. Orient yourself then on suitable top real estate agents in Galder for sales advice in this region.

Residents

1.095

Last year: 2025

Average WOZ

EUR 539.000

Last year: 2025

Average income per person.

EUR 36.100

Source: AllNumbers

Crimes (current year)

17

Total registered

Demographics and WOZ development

Inhabitants per year

Inhabitants per year in Galder
Year Residents
2021 1.065
2022 1.075
2023 1.080
2024 1.080
2025 1.095

Annual WOZ value

WOZ value per year in Galder
Year Average WOZ
2021 EUR 408.000
2022 EUR 448.000
2023 EUR 494.000
2024 EUR 517.000
2025 EUR 539.000

Composition of residents

Age build-up

65+: 245 0-15: 185 15-25: 90 25-45: 240 45-65: 330

Education level

Hoger

260

Praktisch

120

Middelbaar

420

Origin of residents (2025)

Europa

135

Nederland

905

Buiten Europa

50

Housing stock and construction periods

Types of homes

Hoekwoningen 52
Appartementen 11
Tussenwoningen 69
Vrijstaande woningen 292
Twee-onder-één-kap woningen 67

Construction period of buildings

Voor 1700 1
1700 tot 1900 10
1900 tot 1925 16
1925 tot 1950 35
1950 tot 1970 100
1970 tot 1980 49
1980 tot 1990 82
1990 tot 2000 50
2000 tot 2010 48
2010 tot 2020 81
2020 en later 39

Energy and sustainability

Energy label distribution

Label A

114

Label C

98

Label B

84

Label G

41

Label D

39

Label F

32

Label E

5

Label A+++

4

Label A+

3

Label A++

2

Label A++++

1

Label A+++++

0

Average energy consumption per year

Average energy consumption per year in Galder
Year Gas (m3) Electricity (kWh)
2020 1.620 3.830
2021 1.770 3.770
2022 1.340 3.500
2023 1.150 3.400
2024 1.100 3.590

Consumption per house type

Hoekwoning

Gas: 740 • Electricity: 2.380

Huurwoning

Gas: 1.110 • Electricity: 2.820

Koopwoning

Gas: 1.160 • Electricity: 3.520

Appartement

Gas: 1.210 • Electricity: 2.230

Tussenwoning

Gas: 720 • Electricity: 2.550

Vrijstaande woning

Gas: 1.330 • Electricity: 4.010

Twee-onder-één-kap woning

Gas: 1.030 • Electricity: 2.450

Business activity in Galder (2025)

Handel en HORECA 20
Nijverheid en energie 40
Zakelijke dienstverlening 55
Overheid, onderwijs en zorg 30
Landbouw, bosbouw en visserij 25
Vervoer, informatie en communicatie 5
Financiele diensten en onroerendgoed 10
Cultuur, recreatie en overige diensten 20

Total number of company establishments: 205

Recent crime statistics

Recent crime statistics in Galder
Period Crimes
jan 2026 1
jul 2025 4
jun 2025 2
mei 2025 1
mrt 2025 0
mrt 2026 2
nov 2024 1
nov 2025 1
okt 2024 2
okt 2025 1
sep 2024 2
sep 2025 1

These figures give an indicative picture of safety trends in the living environment of Galder.

Frequently asked questions about living in Galder

Short answers based on current local statistics, handy for a quick comparison of the living environment.

Hoeveel inwoners heeft Galder?

Galder telt in 2025 ongeveer 1.095 inwoners.

Wat is de gemiddelde WOZ-waarde in Galder?

De gemiddelde WOZ-waarde in Galder is in 2025 circa € 539.000.

Wat is het gemiddelde inkomen per inwoner in Galder?

Het gemiddelde inkomen per inwoner in Galder ligt rond € 36.100 per jaar.

Hoe veilig is wonen in Galder?

Voor het huidige jaar gaat het om ongeveer 17 geregistreerde misdrijven. Gebruik deze cijfers als indicatie en vergelijk trends per periode.

Welke woningtypen komen het meest voor in Galder?

In Galder komt vooral "Vrijstaande woningen" veel voor, met ongeveer 292 woningen.

Receive free, non-binding quotes

Compare multiple real estate agents and choose the best match.