
Residents
10.582
Last year: 2026
8281NL Genemuiden • Overijssel
For this property, no detailed description is available yet.
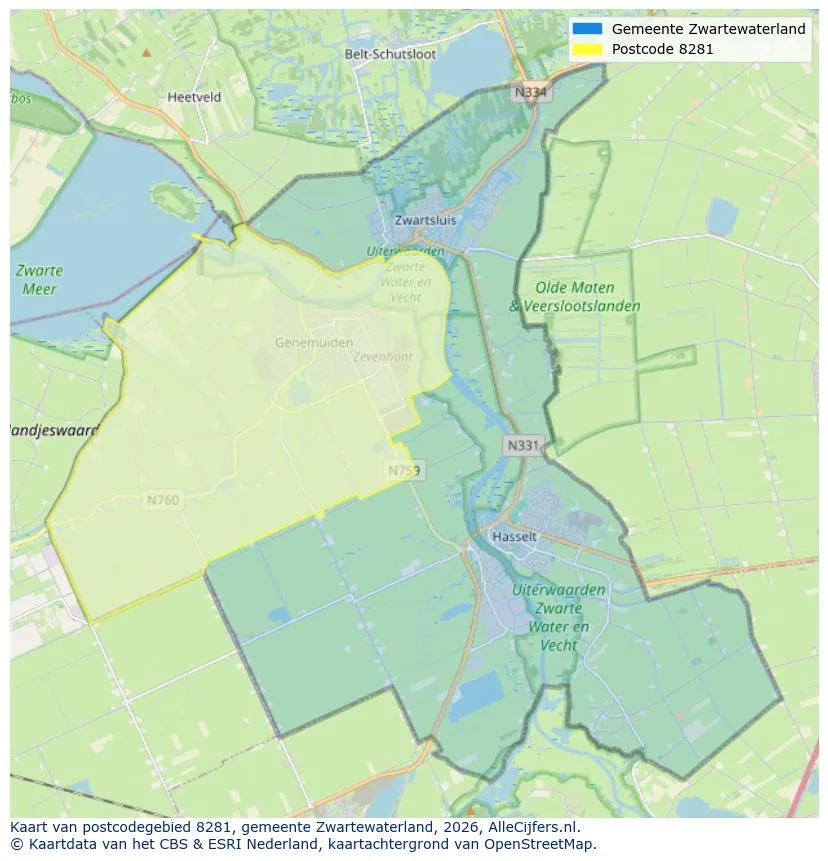
Explore Genemuiden and the surrounding areas
View current location data on residents, WOZ development, housing stock, energy consumption, business activity and safety in Genemuiden. In 2026 were there 10.582 residents. The average WOZ value in 2025 is EUR 343.132.
Residents
10.582
Last year: 2026
Average WOZ
EUR 343.132
Last year: 2025
Average income per person.
EUR 27.099
Source: AllNumbers
Crimes (current year)
173
Total registered
| Year | Residents |
|---|---|
| 2021 | 10.370 |
| 2022 | 10.380 |
| 2023 | 10.485 |
| 2024 | 10.495 |
| 2025 | 10.535 |
| 2026 | 10.582 |
| Year | Average WOZ |
|---|---|
| 2021 | EUR 245.132 |
| 2022 | EUR 271.707 |
| 2023 | EUR 306.698 |
| 2024 | EUR 323.720 |
| 2025 | EUR 343.132 |
Hoger
1.000
Praktisch
3.050
Middelbaar
3.340
Europa
415
Nederland
9.815
Buiten Europa
305
Label C
1.071
Label B
811
Label A
782
Label F
320
Label D
301
Label E
181
Label G
177
Label A+
73
Label A+++
63
Label A++
57
Label A++++
27
Label A+++++
2
| Year | Gas (m3) | Electricity (kWh) |
|---|---|---|
| 2020 | 1.433 | 3.227 |
| 2021 | 1.613 | 3.246 |
| 2022 | 1.275 | 3.071 |
| 2023 | 1.043 | 2.933 |
| 2024 | 1.015 | 3.020 |
Hoekwoning
Gas: 1.082 • Electricity: 2.761
Huurwoning
Gas: 848 • Electricity: 1.990
Koopwoning
Gas: 1.099 • Electricity: 3.198
Appartement
Gas: 567 • Electricity: 1.776
Tussenwoning
Gas: 941 • Electricity: 2.582
Vrijstaande woning
Gas: 1.478 • Electricity: 4.343
Twee-onder-één-kap woning
Gas: 1.159 • Electricity: 3.366
Total number of company establishments: 1.325
| Period | Crimes |
|---|---|
| jan 2026 | 7 |
| jul 2025 | 18 |
| jun 2025 | 11 |
| mei 2025 | 9 |
| mrt 2025 | 12 |
| mrt 2026 | 8 |
| nov 2024 | 16 |
| nov 2025 | 23 |
| okt 2024 | 11 |
| okt 2025 | 18 |
| sep 2024 | 14 |
| sep 2025 | 16 |
These figures give an indicative picture of safety trends in the living environment of Genemuiden.
Short answers based on current local statistics, handy for a quick comparison of the living environment.
Genemuiden telt in 2026 ongeveer 10.582 inwoners.
De gemiddelde WOZ-waarde in Genemuiden is in 2025 circa € 343.132.
Het gemiddelde inkomen per inwoner in Genemuiden ligt rond € 27.099 per jaar.
Voor het huidige jaar gaat het om ongeveer 173 geregistreerde misdrijven. Gebruik deze cijfers als indicatie en vergelijk trends per periode.
In Genemuiden komt vooral "Tussenwoningen" veel voor, met ongeveer 1.397 woningen.
View more homes in this location.

8281LT Genemuiden
€ 375.000 k.k.
€ 3.788/m²

8281CA Genemuiden
€ 370.000 k.k.
€ 3.814/m²

8281ZM Genemuiden
€ 275.000 k.k.
€ 2.619/m²

8281KL Genemuiden
€ 800.000 k.k.
€ 3.980/m²

8281CE Genemuiden
€ 265.000 k.k.
€ 3.681/m²

8281DL Genemuiden
€ 375.000 k.k.
€ 2.953/m²

8281CX Genemuiden
€ 325.000 k.k.
€ 2.462/m²

8281KC Genemuiden
€ 395.000 k.k.
€ 3.086/m²
