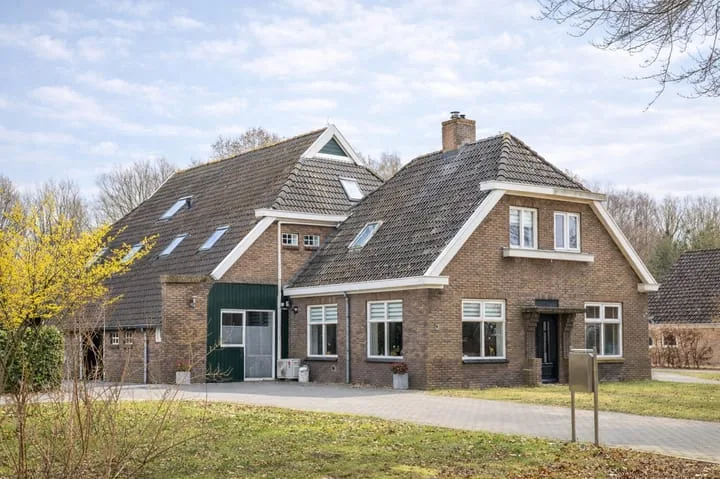
Houses sold in Grolloo

View 3 sold houses in Grolloo

Connected to: Vastgoed Nederland NVM Makelaars

On this page you will find recently sold homes in Grolloo. Use this overview to better estimate selling prices, popular neighborhoods, and the local housing supply before you choose a real estate agent. Also view the current housing supply with 5 houses in Grolloo.

Selection

Search and filter homes

Set your preferences and discover homes that suit you.

Total supply 242.874
Filters

Set price, area and other characteristics. Adjust a filter or click on Show homes. Location changes directly above.

Reset filters

You search for

  • Place Grolloo
  • Status Sold

Huis verkopen in Grolloo? Vergelijk verkoopmakelaars

Bekijk recente verkopen en ontvang gratis offertes van lokale makelaars. Vergelijk meer dan 26 makelaars in Grolloo.

Free request a quote

  • Quotes in Grolloo
  • Non-binding
  • Personal
  • Compare free rates

Zelf je woning verkopen in Grolloo? Vergelijk verkoopmakelaars in Grolloo of bekijk de beste verkoopmakelaars in Grolloo als referentie bij jouw keuze.

Vergelijk meerdere offertes

Makelaars maken scherpere voorstellen als ze weten dat je vergelijkt — vraag offertes aan voor verkoop of aankoop.

Frequently asked questions about sold homes in Grolloo

Short answers about housing prices, sold homes and comparing real estate agents in Grolloo.

Residential and neighborhood statistics in Grolloo

View current location data on residents, WOZ development, housing stock, energy consumption, business activity and safety in Grolloo. In 2025 were there 668 residents. The average WOZ value in 2025 is EUR 412.039.

These figures help to better assess and compare the housing stock in Grolloo with recent sold homes. Orient yourself then on suitable top real estate agents in Grolloo for sales advice in this region.

Residents

668

Last year: 2025

Average WOZ

EUR 412.039

Last year: 2025

Average income per person.

EUR 36.731

Source: AllNumbers

Crimes (current year)

11

Total registered

Demographics and WOZ development

Inhabitants per year

Inhabitants per year in Grolloo
Year Residents
2021 675
2022 694
2023 687
2024 683
2025 668

Annual WOZ value

WOZ value per year in Grolloo
Year Average WOZ
2021 EUR 308.317
2022 EUR 340.708
2023 EUR 396.171
2024 EUR 400.462
2025 EUR 412.039

Composition of residents

Age build-up

65+: 180 0-15: 98 15-25: 76 25-45: 122 45-65: 197

Education level

Hoger

170

Praktisch

100

Middelbaar

220

Origin of residents (2025)

Europa

22

Nederland

620

Buiten Europa

27

Housing stock and construction periods

Types of homes

Hoekwoningen 6
Appartementen 21
Tussenwoningen 10
Vrijstaande woningen 208
Twee-onder-één-kap woningen 98

Construction period of buildings

Voor 1700 1
1700 tot 1900 13
1900 tot 1925 45
1925 tot 1950 57
1950 tot 1970 61
1970 tot 1980 57
1980 tot 1990 59
1990 tot 2000 30
2000 tot 2010 16
2010 tot 2020 7
2020 en later 17

Energy and sustainability

Energy label distribution

Label C

80

Label G

64

Label B

47

Label D

46

Label A

31

Label F

26

Label A+++

9

Label E

7

Label A++++

5

Label A++

3

Label A+

2

Label A+++++

0

Average energy consumption per year

Average energy consumption per year in Grolloo
Year Gas (m3) Electricity (kWh)
2020 1.845 3.495
2021 2.059 3.553
2022 1.619 3.457
2023 1.276 3.215
2024 1.216 3.381

Consumption per house type

Huurwoning

Gas: 1.164 • Electricity: 2.207

Koopwoning

Gas: 1.295 • Electricity: 3.399

Appartement

Gas: 848 • Electricity: 1.243

Tussenwoning

Gas: 1.149 • Electricity: 3.270

Vrijstaande woning

Gas: 1.430 • Electricity: 3.674

Twee-onder-één-kap woning

Gas: 1.027 • Electricity: 2.543

Business activity in Grolloo (2025)

Handel en HORECA 18
Nijverheid en energie 16
Zakelijke dienstverlening 22
Overheid, onderwijs en zorg 11
Landbouw, bosbouw en visserij 9
Vervoer, informatie en communicatie 5
Financiele diensten en onroerendgoed 5
Cultuur, recreatie en overige diensten 16

Total number of company establishments: 103

Recent crime statistics

Recent crime statistics in Grolloo
Period Crimes
jan 2025 0
jan 2026 2
jul 2025 0
jun 2025 1
mei 2025 0
mrt 2025 2
nov 2024 1
nov 2025 1
okt 2024 1
okt 2025 1
sep 2024 1
sep 2025 1

These figures give an indicative picture of safety trends in the living environment of Grolloo.

Frequently asked questions about living in Grolloo

Short answers based on current local statistics, handy for a quick comparison of the living environment.

Hoeveel inwoners heeft Grolloo?

Grolloo telt in 2025 ongeveer 668 inwoners.

Wat is de gemiddelde WOZ-waarde in Grolloo?

De gemiddelde WOZ-waarde in Grolloo is in 2025 circa € 412.039.

Wat is het gemiddelde inkomen per inwoner in Grolloo?

Het gemiddelde inkomen per inwoner in Grolloo ligt rond € 36.731 per jaar.

Hoe veilig is wonen in Grolloo?

Voor het huidige jaar gaat het om ongeveer 11 geregistreerde misdrijven. Gebruik deze cijfers als indicatie en vergelijk trends per periode.

Welke woningtypen komen het meest voor in Grolloo?

In Grolloo komt vooral "Vrijstaande woningen" veel voor, met ongeveer 208 woningen.

Receive free, non-binding quotes

Compare multiple real estate agents and choose the best match.