
Residents
18.708
Last year: 2026
6432GE Hoensbroek • Limburg
€ 205 p/m
Rental price /m²: € 2
For this property, no detailed description is available yet.
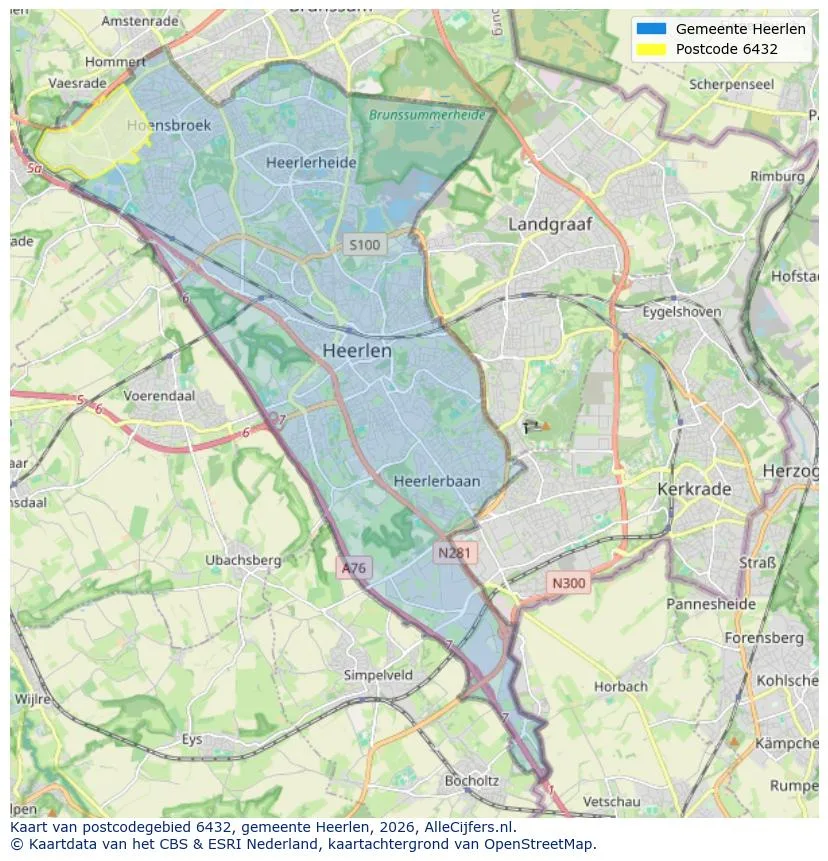
Spatial overview of the work area in Hoensbroek
View current location data on residents, WOZ development, housing stock, energy consumption, business activity and safety in Hoensbroek. In 2026 were there 18.708 residents. The average WOZ value in 2025 is EUR 200.122.
Residents
18.708
Last year: 2026
Average WOZ
EUR 200.122
Last year: 2025
Average income per person.
EUR 27.990
Source: AllNumbers
Crimes (current year)
1.004
Total registered
| Year | Residents |
|---|---|
| 2021 | 18.871 |
| 2022 | 18.826 |
| 2023 | 18.780 |
| 2024 | 18.786 |
| 2025 | 18.700 |
| 2026 | 18.708 |
| Year | Average WOZ |
|---|---|
| 2021 | EUR 151.559 |
| 2022 | EUR 160.700 |
| 2023 | EUR 190.615 |
| 2024 | EUR 185.886 |
| 2025 | EUR 200.122 |
Hoger
2.538
Praktisch
5.579
Middelbaar
5.993
Europa
2.885
Nederland
13.180
Buiten Europa
2.635
Label C
2.728
Label E
1.374
Label B
1.367
Label F
1.353
Label D
1.274
Label A
1.092
Label G
1.009
Label A+
62
Label A+++
48
Label A++++
28
Label A++
16
Label A+++++
2
| Year | Gas (m3) | Electricity (kWh) |
|---|---|---|
| 2020 | 1.173 | 2.668 |
| 2021 | 1.312 | 2.685 |
| 2022 | 1.026 | 2.586 |
| 2023 | 859 | 2.485 |
| 2024 | 833 | 2.535 |
Hoekwoning
Gas: 943 • Electricity: 2.778
Huurwoning
Gas: 778 • Electricity: 2.082
Koopwoning
Gas: 951 • Electricity: 2.936
Appartement
Gas: 710 • Electricity: 1.858
Tussenwoning
Gas: 816 • Electricity: 2.535
Vrijstaande woning
Gas: 1.372 • Electricity: 3.669
Twee-onder-één-kap woning
Gas: 1.050 • Electricity: 2.979
Total number of company establishments: 1.495
| Period | Crimes |
|---|---|
| jan 2026 | 85 |
| jul 2025 | 73 |
| jun 2025 | 84 |
| mei 2025 | 102 |
| mrt 2025 | 84 |
| mrt 2026 | 66 |
| nov 2024 | 76 |
| nov 2025 | 74 |
| okt 2024 | 73 |
| okt 2025 | 87 |
| sep 2024 | 64 |
| sep 2025 | 66 |
These figures give an indicative picture of safety trends in the living environment of Hoensbroek.
Short answers based on current local statistics, handy for a quick comparison of the living environment.
Hoensbroek telt in 2026 ongeveer 18.708 inwoners.
De gemiddelde WOZ-waarde in Hoensbroek is in 2025 circa € 200.122.
Het gemiddelde inkomen per inwoner in Hoensbroek ligt rond € 27.990 per jaar.
Voor het huidige jaar gaat het om ongeveer 1.004 geregistreerde misdrijven. Gebruik deze cijfers als indicatie en vergelijk trends per periode.
In Hoensbroek komt vooral "Tussenwoningen" veel voor, met ongeveer 3.477 woningen.
View more homes in this location.

6431HT Hoensbroek
€ 760 p/m
€ 18/m²

6431GT Hoensbroek
€ 295.000 k.k.
€ 3.041/m²

6432EE Hoensbroek
€ 275.000 k.k.
€ 3.125/m²

6433BE Hoensbroek
€ 279.000 k.k.
€ 2.514/m²

6431XH Hoensbroek
€ 425.000 k.k.
€ 2.273/m²

6433AR Hoensbroek
€ 599.000 k.k.
€ 2.252/m²

6432BH Hoensbroek
€ 298.000 k.k.
€ 2.734/m²

6433CC Hoensbroek
€ 239.000 k.k.
€ 2.951/m²
