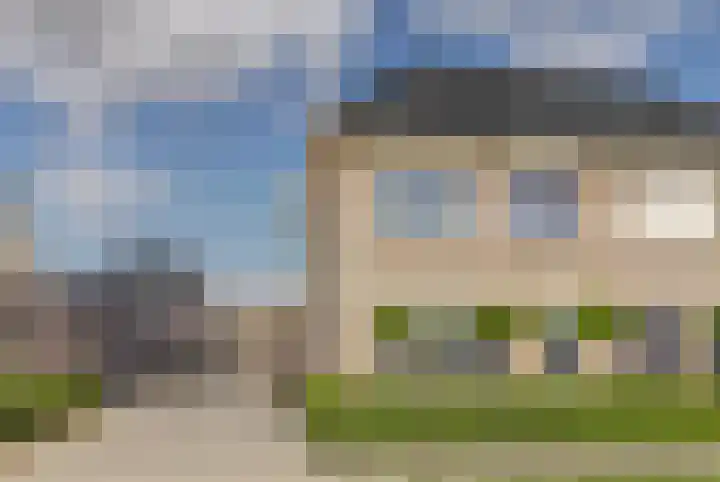
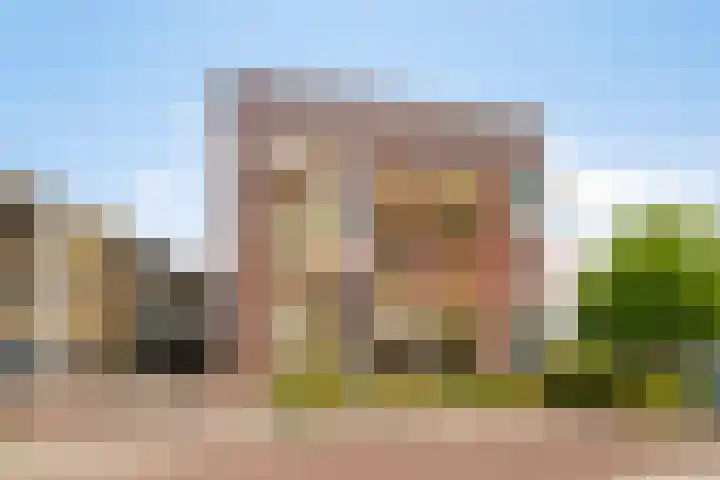
Housing offer in Kapelle

Searching in 121 houses in Kapelle

Connected to: Vastgoed Nederland NVM Makelaars

View the current housing stock in Kapelle and quickly filter by price, living area, rooms and more. There are currently 121 houses in this place within our selection. View also 81 sold houses in Kapelle for extra insight into the local housing market.

Selection

Search and filter homes

Set your preferences and discover homes that suit you.

Total supply 245.304
Filters

Set price, area and other characteristics. Adjust a filter or click on Show homes. Location changes directly above.

Reset filters

You search for

  • Place Kapelle

Selling a home in Kapelle? Compare realtor offers

Get free quotes from real estate agents with local market knowledge. Compare more than 34 real estate agents in Kapelle.

Free request a quote

  • Quotes in Kapelle
  • Non-binding
  • Personal
  • Compare free rates

Selling a home in Kapelle? Compare all real estate agents in Kapelle or view the top 10 real estate agents in Kapelle for extra context for your choice.

Compare multiple quotes

Real estate agents make sharper offers when they know you're comparing — ask for quotes for sale or purchase.

Frequently asked questions about homes in Kapelle

Practical answers about housing supply, sales and comparing real estate agents in Kapelle.

Residential and neighborhood statistics in Kapelle

View current location data on residents, WOZ development, housing stock, energy consumption, business activity and safety in Kapelle. In 2025 were there 9.460 residents. The average WOZ value in 2025 is EUR 377.000.

These figures help to better assess and compare the housing stock in Kapelle with recent sold homes. Orient yourself then on suitable top real estate agents in Kapelle for sales advice in this region.

Residents

9.460

Last year: 2025

Average WOZ

EUR 377.000

Last year: 2025

Average income per person.

EUR 33.700

Source: AllNumbers

Crimes (current year)

256

Total registered

Demographics and WOZ development

Inhabitants per year

Inhabitants per year in Kapelle
Year Residents
2021 9.330
2022 9.420
2023 9.445
2024 9.420
2025 9.460

Annual WOZ value

WOZ value per year in Kapelle
Year Average WOZ
2021 EUR 270.000
2022 EUR 297.000
2023 EUR 341.000
2024 EUR 358.000
2025 EUR 377.000

Composition of residents

Age build-up

65+: 2.130 0-15: 1.635 15-25: 1.135 25-45: 2.110 45-65: 2.450

Education level

Hoger

2.150

Praktisch

1.520

Middelbaar

3.120

Origin of residents (2025)

Europa

515

Nederland

8.365

Buiten Europa

580

Housing stock and construction periods

Types of homes

Hoekwoningen 633
Appartementen 494
Tussenwoningen 1.077
Vrijstaande woningen 1.157
Twee-onder-één-kap woningen 781

Construction period of buildings

Voor 1700 3
1700 tot 1900 55
1900 tot 1925 204
1925 tot 1950 360
1950 tot 1970 721
1970 tot 1980 739
1980 tot 1990 542
1990 tot 2000 460
2000 tot 2010 505
2010 tot 2020 349
2020 en later 255

Energy and sustainability

Energy label distribution

Label A

1.109

Label C

979

Label B

700

Label D

406

Label G

321

Label F

207

Label A+++

173

Label E

147

Label A++++

62

Label A+

35

Label A++

25

Label A+++++

0

Average energy consumption per year

Average energy consumption per year in Kapelle
Year Gas (m3) Electricity (kWh)
2020 1.190 2.680
2021 1.340 2.940
2022 1.050 2.740
2023 890 2.640
2024 870 2.720

Consumption per house type

Hoekwoning

Gas: 850 • Electricity: 2.420

Huurwoning

Gas: 730 • Electricity: 1.760

Koopwoning

Gas: 940 • Electricity: 2.900

Appartement

Gas: 640 • Electricity: 1.660

Tussenwoning

Gas: 760 • Electricity: 2.210

Vrijstaande woning

Gas: 1.110 • Electricity: 3.420

Twee-onder-één-kap woning

Gas: 900 • Electricity: 2.690

Business activity in Kapelle (2025)

Handel en HORECA 190
Nijverheid en energie 185
Zakelijke dienstverlening 270
Overheid, onderwijs en zorg 190
Landbouw, bosbouw en visserij 75
Vervoer, informatie en communicatie 75
Financiele diensten en onroerendgoed 85
Cultuur, recreatie en overige diensten 110

Total number of company establishments: 1.185

Recent crime statistics

Recent crime statistics in Kapelle
Period Crimes
jan 2026 15
jul 2025 17
jun 2025 20
mei 2025 33
mrt 2025 18
mrt 2026 24
nov 2024 8
nov 2025 15
okt 2024 11
okt 2025 22
sep 2024 14
sep 2025 28

These figures give an indicative picture of safety trends in the living environment of Kapelle.

Frequently asked questions about living in Kapelle

Short answers based on current local statistics, handy for a quick comparison of the living environment.

Hoeveel inwoners heeft Kapelle?

Kapelle telt in 2025 ongeveer 9.460 inwoners.

Wat is de gemiddelde WOZ-waarde in Kapelle?

De gemiddelde WOZ-waarde in Kapelle is in 2025 circa € 377.000.

Wat is het gemiddelde inkomen per inwoner in Kapelle?

Het gemiddelde inkomen per inwoner in Kapelle ligt rond € 33.700 per jaar.

Hoe veilig is wonen in Kapelle?

Voor het huidige jaar gaat het om ongeveer 256 geregistreerde misdrijven. Gebruik deze cijfers als indicatie en vergelijk trends per periode.

Welke woningtypen komen het meest voor in Kapelle?

In Kapelle komt vooral "Vrijstaande woningen" veel voor, met ongeveer 1.157 woningen.

Receive free, non-binding quotes

Compare multiple real estate agents and choose the best match.